Keywordsairport competition airport connectivity airport direct connectivity airport indirect connectivity hub connectivity Romanian airports
JEL Classification L10, L21, L22, L25, M10, M20
Full Article
1. Introduction
Over the years, the airport industry has been characterized by strong competition in the attempt to attract numerous airline companies and increase the connectivity performance, either targeting airlines for business, leisure or VFR traffic. According to SEO NetScan (2018) the connectivity performance offered from airport, named the airport connectivity is the sum of all connections offered from an airport, direct (point-to-point) or indirect traffic (hub connections, passenger transfer to other connections).
If the point-to-point connections are being targeted by airport to mainly increase their leisure and VFR traffic, hub connections are targeted for worldwide connections, but also for business traffic as frequency tends to be higher. In general terms, the indirect connections are less attractive to passengers due to connections times, which may vary from airline to airline and from airport to airport. Many airports tend to work closely with airlines to offer quality connection times, this making the airport of original much attractive than competitors with different hub connections.
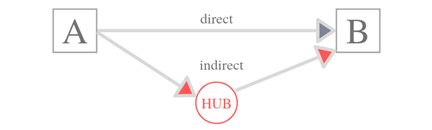
Figure 1. Airport Connectivity – direct and indirect traffic
Source: ACI Europe (2018), author’s concept
2. Theoretical Framework - The Conceptualization of Air Connectivity
According to ACI Europe (2018) there are 4 types of airport connectivity, which can be defined from a dual perspective: qualitative and quantitative. First type is direct connectivity - mainly point-to-point services (direct services from a certain airport) which can be measured in terms of number of destinations, but also of frequency; second type is indirect connectivity: an indicator which measures the number of places people can fly to from a certain airport, while connecting flights are a certain hub. ACI states that indirect connections can be calculated according to their quality, based on connecting time or detour; this type is airport overall connectivity: the most used metric for the overall airport connectivity, adding both direct and indirect connectivity, measuring the level to which an airport is connected to other regions, either by a direct or indirect connection; fourth type is hub connectivity (not the case for Romanian Airports): an important metric for any hub airport such as Frankfurt, Istanbul, London, Munich, Paris, Madrid etc. It measures the number of connecting flights that can be handled by the airport – taking into account minimum and maximum connecting times, essentially weighting the quality of connections from the airport.
OECD – International Transport Forum (2018) defines air connectivity as the ability with which passengers and cargo can reach different destinations by air. In addition, governments recognize that air connectivity plays a crucial role in boosting economic growth by facilitating tourism direct investment and supporting trade. A growing air connectivity should deliver socio-economic benefits, more than now as air travel becomes less expensive and much more accessible due to the deregularization of aviation, the rise of low-cost airline which can use their competitive advantage and cost base to stimulate demand by lower price and the development in technology which makes air travel much affordable and easy to use. OECD – International Transport Forum (2018) details that demand for air transport is driven by a need of the consumer to visit a certain country, visit family and friends or by a company to move people between headquarters and ease the business process. In broad sense, air connectivity must satisfy a need to travel for both personal and business purpose, making the travel from A to B convenient and affordable. For airports, measuring air connectivity can help them to better understand market changes or help them compare their connectivity to their competitors.
The International Civil Aviation Organization – ICAO (2013) defines air connectivity as an indicator of a network’s concentration and its ability to move passengers from their origin to their destination hassle-free. According to PWC (2014) the growth of LCC has made air travel more accessible, thus increasing air connectivity which is the key to a country’s economic growth enabling a more open environment to new business investment and human capital. PWC (2014) zooms into the air connectivity and states that is can be measured by using different metrics – passenger movements, airfares, total number of direct destinations or indirect destinations, travel time, hub connectivity.
According to Figure 2, PWC (2014) classified travelers into different segments according to different priorities or the purpose of the journey. Business travelers are more price inelastic and more time sensitive. In this sense, they are looking for more frequent and flexible services, full service or low-cost companies that land or use airport close to the city – in their case air connectivity can be measured by the frequency of flights, schedule, time of travel, number of direct routes and airports close to the city. Leisure travelers are more price sensitive (price elastic), taking rational decisions in relation to cost-effectiveness.
The VFR segment (Visiting Family and Friends) are a sub-part of the leisure segment, expect that they are highly seasonal and very price elastic. IATA (2017) states that air connectivity provides an important link between the civil aviation industry, tourism and especially trade. On a global scale, IATA estimates that around 54% of passengers are leisure travelers while in regard to trade, 35% of the global trade is transported by air. A higher rate of air connectivity concludes to a reduction of air transport costs and enables a certain place to more connected to the global value chains. For competitiveness reasons, a well connected city can rank highly in the hierarchies of cities as a result of air competitiveness being a key factor in the decisions of opening new branches for multinational organizations.

Figure 2. Airport Connectivity measures (business, leisure/VFR)
Source: PWC (2014), author’s concept
Burghouwt (2017) analyzed the strength of Origin and Destination markets as well as the operations of an airline hub, airspace and airport capacity and constrains, service levels of airports and market access as the major determinants of air connectivity performance. In broad sense, a market access is defined by the author as the availability of traffic rights, slot allocation and airport infrastructure restrictions. Lohmann, Albers and Pavlovich (2009) identified critical factors for airlines operating from their hubs, which included the geographical location of the hub, airport facilities, coordination of schedules. Redondi, Malighetti and Paleari (2010) measured the competition between airport hubs by considering the mimumum travel time required to connect a pair of airports - the analysis showed that the geographical location was the most common driver of performance.
Eurocontrol (2017) looked at air connectivity from different perspectives, measuring air connectivity from door to door. Eurocontrol finds time travel as a first indicator to measure air connectivity, taking into account the first mile last mile problem: measuring the connectivity between certain regions, the connectivity index takes into account the door-to-door connectivity rather than airport-to-airport connectivity – being important for passengers to know how long it will take to get from point A to point B. The second indicator used by Eurocontrol is the population the can be reached out from within an airport area, while the third one is the flight choice, indicating the number of flights that are offered between regions, that can be from one per week to multiple daily frequencies. The fourth and last indicator measuring air connectivity is the number of airlines that are offering flights between different regions.
3. Air Connectivity and its Impact in Romanian Aviation
3.1.Drivers of Air Connectivity
According to PWC (2014) there are 4 major factors that drive air connectivity: geography, airport infrastructure, airline business models and the regulatory and economic framework. Geography is an important factor thus air connectivity is crucial for countries with isolated air travel markets where passengers have limited alternatives to air travel. In case of Romania, all regions have easy access to air travel given the large number of airports in all regions. Airport Infrastructure: airports provide the access and thus the connectivity that are required for a well-performing economy, enabling all businesses to connect to different opportunities and facilitate the incoming tourists from different locations, fueling this was the economic growth of the region. Airline Business Models: a third driver of air connectivity that can be crucial to the development of air traffic. In a competitive market like Romania, airports have been focusing on attracting low-cost carriers in order to boost tourism potential and increase the foreign investment, especially in the tourism field. Regulatory and Economic Framework: - a fourth driver of air connectivity that can either facilitate or constrain the development of air connectivity. Being part of the European Union, Romania has signed different bilateral air services agreements with different states that establish the maximum numbers of airlines that can compete on a certain route or unlimited traffic between different countries within the European Union.
There are also other drivers of air connectivity that can determine the performance of air connectivity of airports or different regions within a country. One of the most important indicators, taken into account by airline companies when opening new routes is the size and strength of local origin-destination market, shorty OD. From an air connectivity perspective, the size of the catchment area of an airport and the economic activities within this catchment area drive demand. Besides the social and economic variables, the cultural, historical and political factors play an important factor in driving demand from a certain airport. In case of Romania, competition from airports serving the same markets can misshape the relationship between the local market and air connectivity. Of Couse, looking at a larger scale, an airport that serves a metropolitan area will have more advantages in terms of air connectivity than airport situated close by and fighting for the market share. We may consider the relationship between air connectivity and OD market as being bi-directional, as air travel keep the economy alive in the airport region and the economic growth can stimulate the demand for air travel and thus creating a better connectivity.

Figure 3. Romanian Airports Catchment Areas (40,60 and 90 km radius) – top 5 airports in terms of 2018 traffic (Bucharest, Cluj, Timisoara, Iasi and Sibiu)
Source: Author’s concept
The presence of an airline hub is another driver of air connectivity. Airports that facilitate an airline hub benefit from a more premium connectivity. In the case of Romania, only Bucharest can be considered an airport with hub operations, as Tarom and Blue Air having extensive operations and numerous aircrafts based at the airport. Airport and airspace capacity is another driver of air connectivity, as airport capacity is an essential condition for air connectivity growth, as well as ATC capacity. In addition to these drivers, airport costs are crucial for air connectivity, much as airline are focusing on cost reduction and volume. The airports cost influence both airlines in their route development strategies as well as passengers as they tend to choose cheaper options, especially in a low-yield market like Romania. Airport service levels is another driver for air connectivity, especially for airlines targeting high-quality for passengers or low-cost airlines who choose airports with a different low-cost terminal. Ultimately, market access is the last driver of air connectivity because airlines can offer a good connectivity in markets where access is not restricted or where infrastructure is well-maintained and not restricted in terms of runway length, slot availability, opening hours etc.
3.2.Romanian Airports Connectivity Analysis, 2014-2018
The connectivity concept, according to ICAO is the capacity of the transport value chain to move passengers, mail or cargo from one point to another with the shortest possible time, maximum client satisfaction and adequate price. Supporting the regulatory framework to optimize connectivity means a good market access which drives connectivity and ultimately drives economic development. Connectivity comprises numerous variables like market access liberalization, taxes, charges, air carrier ownership and control, facilitation and security, consumer protection and fair competition. The air connectivity formula for a certain airport can be defined as a sum or frequency multiplied by the seats per flight multiplied by the airport weightage for every other airport that the airport in question is connected to divided by the scalar factor of 10.000. Subsequently, the airport weightage for an airport can be calculated as the total passengers handled by the airport divided by the total passengers handled by the largest airport, which in Romania’s case is Bucharest.

Figure 4. Romanian Airports Connectivity YOY % ( 2014-2018) – direct and indirect traffic
Source: ACI Europe (2014-2018)
Table 1. Romanian Airports Connectivity YOY % (2014-2018) – direct and indirect traffic, detailed view
| 2018/2017 | 2017/2016 | 2016/2015 | 2015/2014 | ||
| OTP | direct | 2.50% | 11% | 34% | 3% |
| indirect | 11.70% | 0% | -6.60% | 5% | |
| CLJ | direct | -0.50% | 52% | 174% | 2% |
| indirect | 33.80% | 25% | 32.80% | 15% | |
| TSR | direct | -6.70% | 46% | 97.80% | -22% |
| indirect | 8.80% | -12% | 7.10% | -2% | |
| IAS | direct | -6.90% | 33% | 99% | 0% |
| indirect | -0.30% | -4% | 21.80% | 12% | |
| SBZ | direct | 12.30% | 24% | 27.30% | 6% |
| indirect | 20.50% | 8% | 20.50% | -4% | |
| BCM | direct | 9% | -8% | 19.20% | -8% |
| indirect | 0% | 0% | 0.00% | 0% | |
| CRA | direct | 0.10% | 114% | 0.00% | 0% |
| indirect | 0.00% | 0% | 0.00% | 0% | |
| OMR | direct | 27.20% | 81% | 0.00% | 0% |
| indirect | -59.10% | 67% | 0.00% | 0% | |
| CND | direct | -5.20% | 74% | 120.30% | -3% |
| indirect | -2.30% | -17% | 21.80% | -11% | |
| SUJ | direct | 49.40% | 35% | 0.00% | 0% |
| indirect | -66.10% | -25% | 36.80% | 26% |
Source: ACI Europe (2014-2018)
According to ACI Europe database, data for OTP, CLJ, TSR, IAS, SBZ, BCM, CRA, OMR, CND and SUJ has been used to analyzed the direct and indirect traffic (YOY) between 2014 and 2018. As such, on average in 2018/2017 the direct traffic has increased by 8.12% while the indirect traffic decreased by almost 7 percent; in 2017/2016 the direct traffic increased by 46% while the indirect traffic has increased by 6%; in 2016/2015 direct traffic increased by almost 82% on average while the indirect traffic increased by almost 19% while in 2015/2014 direct traffic has decreased by 4% on average while the indirect traffic has increased on average by 6%. Taking each airport separately, we notice big changes for regional airports in terms of both direct and indirect connectivity, explained by the expansion of low-cost carrier in the region, followed by Star Alliance expansion in the region including Lufthansa, Turkish Airlines, LOT Polish Airlines and Aegean. For Bucharest for 4 periods, we can notice a positive direct connectivity from 3% to 34% - although 2016 has been a prolific year for all airports in Romania in terms of direct connectivity, explained by a major expansion of low-cost airlines. Another observation would be for CRA (Craiova) and BCM (Bacau) in terms of indirect traffic, the airports having no hub connections.
3.3.The link between connectivity, passengers number and economic growth
Air transport plays a huge role in developing economies, countries, boosting direct, indirect and also induced benefits as the air connectivity becomes higher. On the other side, the economic growth can have a positive impact on air transportation. From an economic perspective, air transport has an important role in boosting investments in the overall economy, stimulates other industries, creates new jobs and rises in personal income, helps stimulating overall competitiveness. The impact of airports have direct and indirect benefits on the aviation activity that comprises direct economic impact, specifically the employment rate, personal income, GDP of airport on-site companies and airport related businesses near the airport. We may include in here handling operators, airlines, air traffic control, general aviation, the airport security or immigrations, maintenance companies etc.
In regards to Romanian Aviation, the number of passengers grew by almost 8% in 2018 versus 2017, reaching almost 22 million passengers on 2018, by almost 87% in 2018 versus 2014, when a number of almost 12 million passengers were recorded.
Table 2. Romanian Airports Passenger Traffic 2014-2018
| 2014 | 2015 | 2016 | 2017 | 2018 | 2018/2017 | 2018/2014 | |
| Total | 11693931 | 13288994 | 16402241 | 20258088 | 21835545 | 7.79% | 86.73% |
| OTP | 8321858 | 9274629 | 10979501 | 12804191 | 13820428 | 7.94% | 66.07% |
| CLJ | 1182047 | 1485652 | 1880319 | 2688731 | 2782401 | 3.48% | 135.39% |
| TSR | 734716 | 923650 | 1160167 | 1621529 | 1517309 | -6.43% | 106.52% |
| IAS | 273047 | 381603 | 882628 | 1147040 | 1256640 | 9.56% | 360.23% |
| SBZ | 250432 | 278331 | 367207 | 503906 | 662468 | 31.47% | 164.53% |
| CRA | 138886 | 116947 | 222320 | 447571 | 493056 | 10.16% | 255.01% |
| BCM | 313376 | 364727 | 414987 | 425753 | 447531 | 5.12% | 42.81% |
| SCV | 219 | 2359 | 57226 | 262165 | 352991 | 34.64% | 161083% |
| OMR | 36501 | 8118 | 31875 | 162902 | 220012 | 35.06% | 502.76% |
| CND | 37939 | 71165 | 94594 | 121431 | 129235 | 6.43% | 240.64% |
| SUJ | 12644 | 17375 | 23796 | 60795 | 75692 | 24.50% | 498.64% |
| TGM | 343521 | 336694 | 287621 | 748 | 63794 | 8428.61% | -81.43% |
| ARW | 28280 | 8530 | 0 | 11282 | 11367 | 0.75% | -59.81% |
| BAY | 20465 | 19214 | 0 | 44 | 2621 | 5856.82% | -87.19% |
Source: INSSE Romania (2014-2018)
Throughout the years, Bucharest has maintained its leading position, from 8 million passengers in 2014, reaching almost 14 millions in 2018, showing a great dynamic and increasing connectivity, benefiting consumers and local economy. The next airports in the ranking are Cluj with a 135% growth in 2018 versus 2014, followed by Timisoara with a 106% growth, Iasi with a spectacular 360% growth. Next airports in the ranking include Sibiu with 164% growth, Craiova with 255% and Bacau with 42% growth. One observation would be that regional airports such as Oradea have registered a huge increase in the passenger traffic and thus air connectivity , but due to low demand, closeness to bigger airports (in the top 5), the increase rate is set to slow down in the coming years or decrease.
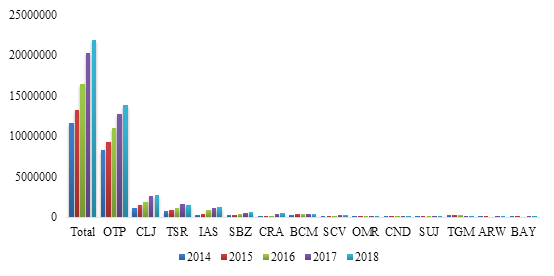
Figure 5. Romanian Airports Passenger Traffic 2014-2018, absolute values
Source: INSSE Romania (2014-2018)

Figure 6. Romanian Airports Passenger Traffic, % rates, 2018 vs 2017, 2018 vs 2014
Source: INSSE Romania
Table 3. Correlation Pax trafic % and GDP %, 2014-2018
| Years | 2018/2017 | 2017/2016 | 2016/2015 | 2015/2014 |
| YOY Passengers Total Romania (%) | 7.79% | 23.51% | 23.43% | 13.64% |
| YOY GDP Romania (%) | 3.96% | 6.95% | 4.82% | 3.87% |
| Correlation Pax Traffic - GDP | 0.750067837 | |||
Source: Author’s research
Figure 9 from above shows the correlation between the passenger traffic YOY % and GDP Romania YOY %. As shown by air connectivity chart, 2016 was the most prolific year for the Romanian market in terms of passenger and air connectivity growth. The number of passengers increased by 23.43% to 2015 while the GDP has a 5% increase to previous year. A 0.750 correlation indicates that there is a medium to strong relationship between the number of passengers – variable (x) and the GDP – variable (y). However, for this relationship to be more accurate, a longer period should have been taken into account – for at least in the past 7 to 10 years.

Figure 7. YOY %, passengers total Romania versus GDP
Source: Author’s research

Figure 8. Scatter graphic, YOY% passengers total Romania and GDP.
Source: Author’s research
Figure 11 from above shows a scatter graphic, YOY % passengers total Romania and GDP. As observed, it is a linear relationship between the two variables. Even though the period should have been extended to 7 or more years for the 4 year period, the R squared (coefficient of determination) shows a medium to strong relationship between the two variables. In addition, the equation shows that a 1% increase in the number of passengers triggers an average GDP increase by 0.1388%. The expansion of low-cost carriers translated by a larger market share in the past 4 years, has boosted tourism and foreign investment, allowing the economy to grow, thus explaining the important role that air transport has on the economy.
4. Conclusion
Overall, air connectivity is an important tool for all airports to quantify their performance and plays and important role in boosting local economic development and support the region’s long-term economic growth. Helping out the movement of cargo and people, local regions can win from knowledge and investment while integrating into the global economy by having a positive impact on productivity and economic performance. Local regional leaders and governments should get involved more in understanding the benefits of a good air connectivity index and facilitate more policies to grow connectivity by different economic stimulus. For Romania, as proven, the stakeholders need to focus on the development of aviation infrastructure, attracting new airline companies while ensuring that airports have enough capacity to meet the ongoing growing demand. For current airports, keeping a good aviation infrastructure is crucial for ensure a good air connectivity and not lose the competition with nearby airports or countries. As the number of passengers grows, so does the GDP and this means that airlines need to continue to find new routes to meet shifting demand.
References
- Airports Council International, 2015. Economic Impact of European Airports. A Critical Catalyst to Economic Growth [online] Available at: http://www.intervistas.com/downloads/reports/Economic%20Impact%20of%20European%20Airports%20-%20January%202015.pdf [Accessed 21 January 2019].
- Airports Council International, 2018. ACI Europe – Airports Connectivity Reports 2018-2014 [online] Available at: https://www.aci-europe.org/policy/connectivity.html [Accessed 20 January 2019].
- Airports Regions Conference, 2017. Air Connectivity in European Regions [online] Available at: https://airportregions.org/wp-content/uploads/Air-Connectivity-in-European-Regions.pdf [Accessed 21 January 2019].
- Boonekamp, T. and Burghouwt, G., 2017. Measuring connectivity in the air freight industry. Journal of Air Transport Management, 61, (C), pp.81-94.
- Caribbean Development Bank, 2018. Air Transport competitiveness and connectivity [online] Available at: http://www.caribbeanhotelandtourism.com/wp-content/uploads/2018/07/Air-Transport-Competitiveness-and-Connectivity-Study-2018.pdf [Accessed 20 January 2019].
- Centre for Aviation, 2016. Aviation connectivity in Europe: the EU and airlines could learn lessons from the Gulf and Turkey [online] Available at: https://centreforaviation.com/analysis/reports/hold-connectivity-in-europe-the-eu-and-its-airlines-could-learn-lessons-from-the-gulf-and-turkey-266126?fbclid=IwAR3t7xQWKypLmC4FFiZgkujIqei96cpyK_cJzgP9EEVhRQN2oqGiac2yPuc [Accessed 15 January 2019].
- European Commission, 2017. Annual Analyses related to the EU Air Transport Market 2016 [online] Available at: https://ec.europa.eu/transport/sites/transport/files/2016_eu_air_transport_industry_analyses_report.pdf [Accessed 12 February February 2019].
- European Commission, 2018. Romania: Economic Forecast for Romania [online] Available at: https://ec.europa.eu/info/business-economy-euro/economic-performance-and-forecasts/economic-performance-country/romania/economic-forecast-romania_en [Accessed 1 February 2019]
- International Transport Forum, 2017. Defining, Measuring and Improving Air Connectivity [online] Available at:https://www.itf-oecd.org/sites/default/files/docs/defining-measuring-improving-air-connectivity.pdf [Accessed 9 February 2019].
- International Transport Forum, 2017. Influencing Air Connectivity Outcomes [online] Available at: https://www.itf-oecd.org/sites/default/files/docs/influencing-air-connectivity-outcomes.pdf [Accessed 18 January 2019].
- Lohmann, G, Albers, S, Koch, S. and Pavlovich, K., 2009. From hub to tourist destination - an explorative study of Singapore and Dubai's aviation-based transformation. Journal of Air Transport Management, vol. 15, no. 5, pp. 205-211.
- Malighetti, P., Palerari, S. and Redondi, R., 2010. Has Ryanair’s pricing strategy changed over time? An empirical analysis of its 2006–2007 flights. Tourism Management, 31, pp.36–44.
- PwC, 2014. Air connectivity: Why it matters and how to support growth [online] Available at: https://www.pwc.com/gx/en/capital-projects-infrastructure/pdf/pwc-air-connectivity.pdf [Accessed 21 January 2019].
- Statista, 2019. Romania: Growth rate of the real gross domestic product (GDP) from 2012 to 2022 [online] Available at: https://www.statista.com/statistics/373173/gross-domestic-product-gdp-growth-rate-in-romania/ [Accessed 1 February 2019].
- United Kingdom Airports Comission, 2013. Aviation Connectivity and Economy 2013 [online] Available at: https://assets.publishing.service.gov.uk/government/uploads/system/uploads/attachment_data/file/138162/aviation-connectivity-and-the-economy.pdf [Accessed 10 February 2019].
Article Rights and License
© 2019 The Author. Published by Sprint Investify. ISSN 2359-7712. This article is licensed under a Creative Commons Attribution 4.0 International License.