Keywordsfinancial distress financial health insurance risk life insurance
JEL Classification G20
Full Article
1. Introduction
The insurance business in Indonesia is facing rapid changes and dynamics in various fields, such as: politics, economics, social, cultural, defense, and security. In the recent years, the insurance industry has been facing a massive disruption that was triggered by information technology massive development, rapid climate change, and the spread of Covid-19 pandemic in 2020. These phenomena have had a very serious impact on Indonesia’s economy, on corporate businesses, Small and Medium Enterprises, as well as on individuals who are their customers. Figure 1 shows the growth of life insurance businesses in Indonesia from 2015 to 2019.
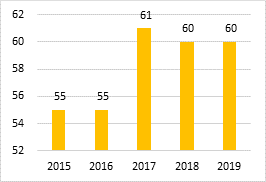
Figure 1. Number of Indonesian life insurance companies between 2015 – 2019
Source: Indonesian insurance statistics 2019
The financial condition of life insurance companies in Indonesia has received public attention; particularly due to the recent failures of large insurance companies. The results of a study by Brigham and Daves (2003) stated that insurance companies in Scandinavian countries in 1990-2000 failed in various proportions, due to economic factors of 37.1%, financial factors of 47.3%, due to negligence, disasters, and fraud by 14%, as well as other factors of 1.6%. The number of life insurance companies default cases in the past five years has caused concern among the public. The default nominal value is quite large and occurs in two of the oldest and largest life insurance companies in Indonesia. The large number of defaults on insurance companies in Indonesia has led the rating agency Fitch Ratings to conduct a research on the financial industry in Indonesia. The results show that some of the defaults come from Indonesia’s Non-Bank Financial Industry (IKNB) companies, because the industry is not as tightly regulated as the banking sector. Indeed, there are several IKNB regulations issued by OJK, but the supervision carried out on IKNB has not been maximal. It should be an increasingly complex risk to be balanced with adequate risk management. Risk management is not only intended for IKNB interests, but also for the community benefit as services users.
This research was conducted to:
a. Analyze the simultaneous effect of the financial health indicators including the solvability, the liquidity, the risk level, the investment adequacy, and the equity on the financial distress in life insurance companies in Indonesia.
b. Analyze the partial effect of the financial health indicators including the solvability, the liquidity, the risk level, the investment adequacy, and the equity on the financial distress in life insurance companies in Indonesia.
c. Analyze the moderating risk level effect on the causal relationship among the solvability, the liquidity, the investment adequacy, and the equity with the financial distress in life insurance companies in Indonesia.
2. Literature Review
There are several studies on a number of variables which will be studied in this research explained in the following subsections.
2.1. Solvability
Sensi (2006) stated that solvability is a ratio to measure the ability of an insurance company to cover all liabilities on time. In line with Sensi (2006), Fahmi (2011) argued that solvability is a reflection of a company’s ability to pay debts on time. Solvability determination is measured by Risk Based Capital (RBC), where the Allowed Assets are reduced by Liabilities, then divided by Risk Based Minimum Capital.
2.2. Liquidity
Liquidity is the company’s ability to meet financial obligations at any time. The obligations in question include the ability to pay debts when they are collected and the ability to finance day-to-day operations of the company. The liquidity determination used is the current ratio formula; in which Current Assets are divided by Current Liabilities.
2.3. Investment Adequacy
Investment Adequacy shows the company’s ability to have assets in the form of investment plus cash and bank in fulfilling its own retention obligations plus other liabilities to policyholders. Investment Adequacy Determination is measured by the Investment Adequacy Ratio; in which the investment is added by cash and bank, then divided by the technical reserves for self-retention and other liabilities of policyholders.
2.4. Equity
Equity is the company’s net assets in the form of the difference between Assets and Liabilities and Subordinated Loans.
2.5. Financial Distress
It should be stated the bankruptcy concept from Notional Theory which refers to the perception of financial ratios which are the main indicators of company health (Lim and Jessica, 2012). Brigham and Daves (2003) stated that financial distress occurs when a company is unable to meet its obligation payment schedule or when cash flow projections indicate that the company is experiencing financial difficulties and will not be able to meet its obligations. Altman (2002) developed a bankruptcy method with a reliable level of accuracy in predicting bankruptcy. The Altman Z-score model is an indicator of bankruptcy performance that is not stagnant, but continues to evolve along with the condition of the company and the conditions in which the method is applied. Altman Model Modification is developed; so that, the model can be used in manufacturing and non-manufacturing companies; including financial companies in developing countries.
2.6. Insurance Risk Measurement
Companies face various risks that can cause failure in achieving their goals. Risk management needs to be implemented to minimize risk. One part of risk management is measuring and assessing risk. The risk types are management, governance, strategic, operational, assets and liabilities, insurance, and financial support risks. Each risk is assigned a risk value, then weighted per risk type and is calculated as a whole to produce a composite value called a risk level consisting of low, medium, medium, high, and very high risks.
2.7. Previous Studies
Some studies have been conducted previously to examine the relationship of financial distress with a number of relevant independent variables. Al-Manaseer and Al-Oshaibat (2018) conducted a study to determine the validity of the Altman z-score model in predicting financial failure of insurance companies listed on the Amman Stock Exchange between 2011-2016. The results of the study found that the highest prediction of financial distress was the Z-score model, while Oniga (2016) analyzed the application of the classic bankruptcy prediction model for Romanian insurance companies. The test results on the four models showed that the Altman Z Score model had the best performance in insurance companies with an accuracy ratio of 63%. Cohen et al., (2017) stated that the initial signal of financial distress in government companies is the percentage of expenditure on income, the ratio of short-term liabilities to income, and the company’s dependence on subsidies. Research by Farook and Abeysekara (2018) stated that the companies liquidated by the court were mostly companies that experienced severe liquidity problems. In Jordan, Al-khatib (2012) research used two models, namely Logistic Regression and Discriminant Analysis, showing that Logistic Regression and Discriminant Analysis were able to predict financial difficulties, as well as return on equity and return on assets which were the two most important financial ratios and were very helpful in predicting public finance companies difficulties listed on the Amman Stock Exchange.
Habib, Bhuiyan and Ainul Islam (2013) stated that there was evidence that companies experiencing financial difficulties would manipulate their profits, including changing market prices without specifying the reason. The magnitude of the influence caused by financial difficulties encouraged the models development in predicting financial distress, so that the occurrence possibility could be known and anticipated early on.
Halteh, Kumar and Gepp (2018) concluded that the ratio of working capital to total assets was the most important or crucial variable in predicting financial distress using the Altman Z-Score method. Meanwhile, Nyang’au and Ngacho (2018) stated that changes in solvability and companies’ financial health greatly affected the companies’ financial performance prediction listed on the Nairobi Securities Exchange (NSE); especially those related to financial difficulties. Financial distress was a major threat to many companies globally regardless of their size and nature. The results of the published analysis of financial statements from nine manufacturing companies listed in NSE shown that changes in solvability and financial health could change financial performance predictions related to companies’ financial distress listed in NSE.
Hu and Zheng (2015) revealed the special treatment of state-owned companies in China which must be separated between companies that had value and those that had no value. It was because each had different levels of financial difficulty; so that, their treatment was also different from one another. Meanwhile, Hu and Sathy (2015) stated that a model that used two variables in the form of financial and non-financial was much better at predicting financial difficulties than using only one variable in the form of finance. This information was useful for investors, policy makers, auditors and stakeholders in the Hong Kong stock market.
Al-Tamimi (2012) stated that there was a significant positive relationship between financial difficulties and corporate governance in the national banks of the United Arab Emirates (UAE). It was concluded that it was important to carry out transparency in disclosing the interests of shareholders in the company, stakeholders, and the role of the board of directors. There was an insignificant positive relationship between governance and performance levels and a significant positive relationship between governance and financial distress.
Khaliq et al. (2014) conducted research on 30 companies listed on Bursa Malaysia between 2008-2012. It was stated that there was a strong relationship between the Altman Z score and financial ratios. The debt ratio could show a significant relationship with the Altman Z score; so that, the Altman Z score could determine the company’s financial difficulties. It was important for the organization to identify the causes of failure and take the necessary action. The results showed that there was a significant relationship among the current ratio, the debt ratio and the Altman Z Score in determining financial distress.
Kutum (2015) stated that insurance companies were most at bankruptcy risk when compared to other service industries. The Palestinian economy was very vulnerable and full of risks, due to its erratic socio-political climate. Therefore, the investors must critically examine their investments in companies there. The study used 2014 financial report data on 41 non-bank companies on the Palestine Exchange which were categorized as 12 industries, 7 insurance, 10 investments, and 12 services. The Altman Z Score model was used to classify companies in various financial distress positions, i.e., safe zone, gray, and stress zone. The results showed that as many as 52% of companies were in stress zone, 24% were in gray zone, and 24% were in safe zone. The sector with the most bankruptcy possibility was insurance companies, followed by service companies and investment companies.
Madhushani and Kawshala (2018) conducted research on 31 non-bank financial institutions listed on the Colombo Stock Exchange Sri Lanka between 2012-2016. The use of Altman Z Score and Leverage ratio showed that financial distress had a significant effect on financial performance. Nanayakkar and Azeez (2015) conducted a study to predict financial difficulties in public companies in Sri Lanka between 2002-2011 by using the Altman Z Score model. The results given from four variables, namely earnings before interest and taxes on total assets, cash flow to total liabilities, return on total assets, and company size greatly influence financial distress with an accuracy of 85.8%. Besides, companies with a distress zone must perform financial distress mitigation measurement not only by looking at accounting information, but also by paying attention to cash flow and financial data.
Oz and Yelkenci (2017) revealed that the component of earnings could be used to predict financial difficulties more accurately. In addition, the use of more samples from different industries in different countries not only increase the validity of the financial distress prediction results, but also contribute in making general prediction models for each of the different industrial sectors. Parkinson (2016) used case study research as a means of being able to explore corporate governance when companies experienced financial difficulties. The results showed that when the company experienced financial difficulties, the company directors paid more attention to the creditors’ interests than the shareholders; which means it was not in line with the corporate governance model.
Rianti and Yadiati (2018) analyzed the effect of company size on financial distress in agricultural companies listed on the Indonesia Stock Exchange. As a sample, 18 companies were used and with secondary data obtained from the financial statements of the Indonesian Capital Market Directory between 2012-2014. The results showed that company size had an effect, but not significantly, on financial distress.
Samanhyia, Oware and Yaansah (2016) concluded that bad corporate governance contributed to financial difficulties and the number of directors in the company could affect company performance. The researchers predicted financial difficulties and bankruptcy of banks listed on the West African stock exchange in Ghana between 2008-2014. The studyresults concluded that poor corporate governance contributed to financial hardship and small board size had an impact on company performance. It was also concluded that competitive industrial conditions could make the company more efficient and improve company performance; so that, the financial difficulties possibility was less likely. A bank merger could provide financial stability to banks, even though one bank was experiencing financial difficulties. The sufficient guarantee fundsavailability from the Central bank could reduce bankruptcies.
Waqas and Rus (2018) conducted a study by predicting financial difficulties in companies in Pakistan which consisting of 290 companies from 2007-2016 and using Logistic Regression. The results showed that profitability, liquidity, leverage, cash flow and company size had significant effects on financial distress.
Ong’era (2017) conducted research with the aim of knowing the liquidity effect as financial distress in companies listed on the Nairobi Securities Exchange (NSE). The Capital Market Authority (CMA) had regulatory responsibilities to oversee the performance of companies listed on the stock exchange and to attract more listings. The crisis in issuers in which more than 16 companies listed in NSE had experienced financial challenges in the last 5 years was a worrying trend, because it had a negative impact on economic growth. This crisis demonstrated the missing link between regulatory oversight and company management. Specifically, the study examined liquidity as a possible cause of financial distress in NSE-listed companies. The study used a descriptive research design. All companies totaling 65 companies registered as of 31 December 2011 in NSE were used. The Logistic Regression Model was determined to establish the relationship between the dependent and independent variables. The relationship model provided a moderate fit, but showed that liquidity was one of the potential predictors of financial distress in NSE-listed companies.
Ogachi et al. (2020) conducted a study of 64 companies listed on NSE for ten years. Logistic analysis was used in building models to predict the company’s financial difficulties. The results showed that asset turnover, total assets, and working capital ratios had a positive coefficient. On the other hand, inventory turnover, debt to equity ratio, debtor turnover, debt ratio, and current ratio had negative coefficients. The research concluded that inventory turnover, asset turnover, debt to equity ratio, debtor turnover, total assets, debt ratio, current ratio, and working capital ratio were the most significant ratios for predicting bankruptcy.
Wanjohi et al. (2017) stated that an efficient risk management system took time. Risk management was one of the basic tasks that must be performed, once risks had been identified. Risk and return were directly related to each other, which meant that by increasing one, the other would increase and vice versa. The research objective was to analyze the effect of financial risk management on the financial performance of commercial banks in Kenya. Research on risk management practices of commercial banks and linking them to bank financial performance. Return on assets was averaged over 5 years, namely 2008-2012 to represent the bank’s financial performance. Assessment of financial risk management practices, self-administered survey questionnaires were used throughout the bank. This study used Multiple Regression Analysis in data analysis and the findings were presented in the form of tables and regression equations. The study found that the majority of banks in Kenya practice sound financial risk management and consequently the financial risk management practices mentioned here had a positive correlation with the financial performance of commercial banks in Kenya. The study recommended that banks should design modern risk measurement techniques such as risk value, simulation techniques and risk-adjusted returns on capital. The study also recommended the use of derivatives to mitigate financial risk as well as developing training tailored to the needs of banking personnel in risk management.
Salehi, Shiri and Pasikhani (2016) stated that financial distress was financial difficulty which was the most important thing for the company. During the last four decades predicting company bankruptcy and financial difficulties had become a concern and very important for various stakeholders in a company. Also, Memba (2013) stated that the most significant causes of financial difficulties were improper capital decisions, insufficient capital, shortage of skilled personnel, poor accounting records and poor internal management. Additionally, Mogotsinyana et al. (2019) stated that financial risk management and financial performance must be in balance in order to provide security and positive benefits for banks.
2.8. Research Framework
Based on the literature reviewmentioned earlier, the research framework is presented as follows:
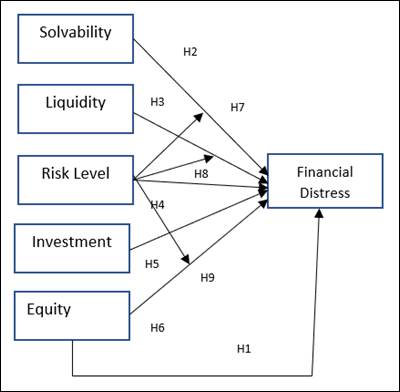
Figure 2. research framework
2.9. Hypotheses
The hypotheses in this study that relate to the research problem are:
H1: Simultaneously, the financial health indicators which include the solvability, the liquidity, the risk level, the investment adequacy and the equity have an effect on the financial distress.
H2: The Solvability affects the financial distress.
H3: The Liquidity affects the financial distress.
H4: The Risk Level affects the financial distress.
H5: The Investment adequacy affects the financial distress.
H6: The Equity affects the financial distress.
H7: The Risk Level moderates the solvability’s effect on the financial distress.
H8: The Risk Level moderates the liquidity’seffect on the financial distress.
H9: The RiskLevel moderates the investment adequacy’seffect on the financial distress.
H10: The risk level moderates the equity’seffect on the financial distress.
3. Research Methodology
In this study, the researchers used insurance financial health indicators consisting of the solvability, the liquidity, the risk level,the investment adequacy, and the equity as well as the financial distress as measured by the Altman Z score. The data used came from the audited annual financial reports of the insurance companies in Indonesia in 2015-2019 which were obtained from the OJK and the Indonesia’s Central Statistics Agency (BPS), through the website pages www.ojk.go.id and www.bps.go .id.
3.1. Research Method
This study used Purposive Random Sampling technique with a population of 40 life insurance companies in Indonesia that were registered with the OJK and regularly provided financial reports to the OJK.
3.2. Data Type
The data type used in this research was secondary data which contained in the annual reports and financial audit reports of life insurance companies submitted to the OJK in 2015 - 2019.
3.3. Collecting Data Method
The life insurance companies’ samples in Indonesia were life insurance companies registered with the OJK which were determined based on the terms and criteria formulated by the researcher. The insurance companies’ data whichwere used starting from 2015, because in that year, the Financial Services Authority Regulation Number 71 / POJK.05 / 2016 concerning the Financial Health of Insurance Companies came into force. Likewise, the insurance risk level assessment came into force in 2015 based on a Service Authority Circular Letter. Finance Number 3 / SEOJK.05 / 2015 concerning Risk Level Assessment of Insurance Companies and Reinsurance Companies. The criteria formulated as a basis for selecting research samples were presented as follows:
1) Life insurance companies in Indonesia registered with the OJK in 2015-2019.
2) Life insurance companies in Indonesia that had reported their annual reports and audited financial reports on time.
3) Life insurance companies in Indonesia that had completed the data on their annual reports in 2015-2019.
4) Life insurance companies in Indonesia that had not had their operational licenses revoked and were under the supervision of the OJK.
Table 1. Number of Research Data Samples
| Notes | Amount |
|
Number of Life Insurance Companies in Indonesia. |
60 |
| Sharia Insurance Company | (7) |
|
Insurance companies that do not have complete financial annual report data. |
(8) |
|
The company has its operational license revoked and is under the supervision of the OJK. |
(5) |
|
Number of companies as samples |
40 |
| Period 2015-2019 | 200 |
Table 1 showed that the number of life insurance companies in Indonesia in 2019 is 60 companies, including 8 insurance companies that did not have a complete financial report data, 5 companies that were under OJK supervision, and 7 sharia insurance companies. So the number of the samples that could be researched were based on the criteria that had been formulated is 40 life insurance companies in the period 2015 to 2019 (five years), so that the total number of data samples used was 200. Operational Research Variables could be seen in Table 2.
Table 2. Operational Research Variables
| Variable | Indicator | Scale |
| SOLVABILITY |
The higher the solvability ratio, the better; it shows the company’s ability to fulfill all obligations. Resources: (www.ojk.go.id, 2019) |
Note: RBC = Risk Based Capital AA = Adequacy Assets L = Liability MRBE = Minimum Risk Based Equity |
| LIQUIDITY |
The higher the liquidity ratio, the better; it shows the company’s ability to meet its obligations at any time. Resources: (www.ojk.go.id, 2019) |
Note: CR = Current Ratio AL = Current Assets LL = Liabilitity Assets |
| INVESTMENT ADEQUACY |
The higher the investment adequacy ratio, the better;
it shows the company’s ability to meet its obligations for its investment. Resources: (www.ojk.go.id, 2019) |
Note: IAR = Investment Adequacy Ratio I = Investment C = Cash ORTR = Own Retention Technical Reserve OPL = Other Polisholder Liabilities |
| EQUITY |
The greater the equity, the better, it shows the company’s ability to develop its business. Resources: (www.ojk.go.id, 2019) |
E = Equity A = Assets L = Liability SL = Subordination Loan |
| RISK LEVEL |
The higher the risk level scale value means the worse it is;it indicates a high probability of failure of the company in fulfilling its obligations. Resources: (www.ojk.go.id, 2018) |
Low= 1 Middle Low= 2 Middle High= 3 High = 4 Very High = 5 |
| FINANCIAL DISTRESS |
The greater the Z Score value in financial distress, the better, it indicates that the company is healthier. Resources: (Altman, 2002) |
Z Score = 6.56 X1 + 3.26 X2 + 6.72 X3 + 1.05 X4 Note: X1 = equity/ total assets X2 = profit/ total assets X3 = earning before tax/ total assets X4 = equity / liability |
3.4. Data Analysis Method
The data analysis with descriptive variables in this study was using Eviews 9 software. The analysis was carried out by describing the collected data without formulating generally accepted conclusions. The descriptive analysis method with quantitative approach was used to get the descriptions of the size, frequency, average, minimum and maximum of the research samples during the study period; in 2015-2019. This analysis was needed to see the entire samples in details that had been collected and met the research requirements.
3.5. Regression Analysis of the Panel Data
The regression analysis of the Panel data was a regression analysis method by combining two kinds of data, namely cross section data and time series. Panel data was a method used to analyze empirically with more dynamic behavior or data characteristics. Cross section data was understood as data collected by observing many subjects, in this case the insurance companies at a certain time, while time series data was understood as data collected from time to time on an insurance company. Linear Regression Model with time series data required an autocorrelation test, because the nature of the time series data was not so dominant. The autocorrelation test only had a value in one regression model. If in one model there were several results from the Autocorrelation test, then the test was no longer valid. Therefore, the autocorrelation test was not required for the OLS or GLS approaches.
4. Analysis and Results
The results of descriptive statistical analysis to describe the data characteristics used in this study can be seen in Table 3:
Table 3. Financial Health Condition of the Life Insurance Industry in Indonesia 2015-2019
| FINANCIAL DISTRESS | SOLVABILITY | LIQUIDITY | INVESTMENT ADEQUACY | EQUITY | RISK LEVEL | |
| Mean | 2.77 | 897.23 | 448.64 | 410.75 | 31.53 | 1.59 |
| Median | 2.05 | 583.85 | 263.38 | 178.75 | 23.70 | 2.00 |
| Maximum | 25.92 | 13967.00 | 4399.50 | 7934.30 | 94.92 | 3.00 |
| Minimum | -7.79 | 31.00 | 97.00 | 86.90 | 2.51 | 1.00 |
| Std. Dev. | 3.72 | 1321.31 | 547.71 | 788.37 | 22.13 | 0.57 |
Source: Results of Eviews 9 Data Processing
The average solvability of life insurance in Indonesia for the five-year period in 2015-2019 tended to show a decline. This showed that there was a sizeable capital injection from the life insurance company, so that the solvability became large. If the operational costs were large enough, the solvability would be small. Meanwhile, the average liquidity condition of life insurance in Indonesia since 2015 until 2019 had been decreasing. This showed that the average life insurance company in Indonesia did not have sufficient or low liquidity, so that it was possible that life insurance companies would face difficulties in paying their short-term obligations to policyholders or their heirs. The average condition of the investment adequacy of Indonesian life insurance since 2015-2019 had decreased, resulting in difficulties in making payment of its obligations at the maturity of the policy, because the average availability of investment adequacy must be greater than the company’s liabilities to policyholders. The average condition of the life insurance industry in Indonesia is getting smaller, which wilould hinder the product development and implementation of the company’s business strategy. There was also a downward trend in the average Z Score of the life insurance industry in Indonesia, which indicated that it could cause financial difficulties in the insurance industry in Indonesia.
4.1. Estimation Model Testing
The results of the Chow Test were carried out to select an estimation model between Common Effect (CEM) or Fixed Effect (FEM) in Table 4, the probability value (Prob.) For Cross-section F was 0.0000 which described the probability value (Prob.) <0.05, so that the model the correct estimation was Fixed Effect (FEM).
Table 4. Results of Estimation Model Testing with the Chow Test
| Effects Test | Statistic | d.f. | Prob. |
| Cross-section F | 24.4555 | (39) | 0.0000 |
Source: EViews 9 Output Results
The results of the Hausman test were carried out to select an estimation model between FEM and REM. In Table 5, the probability value (Prob.) For the random cross-section was 0.0000, which meant the probability value (Prob.) <0.05, so that the appropriate estimation model was FEM. Through these two tests, it could be concluded that the most appropriate estimation model was the Fixed Effect Model.
Table 5. Estimation Model Testing Results with the Hausman Test
| Test Summary | Chi-Sq. Statistic | Chi-Sq. d.f. | Prob. |
| Cross-section random | 26.6648 | 5 | 0.0001 |
Source: EViews 9 Output Results
4.2. Classic Assumption Testing
1) Multicollinearity and HeteroscedasticityTesting
Correlation testing between variables was used to see whether there was multicollinearity between the independent variables. Table 6 shows no multicollinearity among all the variables of SOLVABILITY, LIQUIDITY, RISK LEVEL, INVESTMENT ADEQUACY, and EQUITY. There was no correlation value that was > 0.9, so it was proven that there was no multicollinearity between the independent variables.
Table 6. Multicollinearity Results
| SOLVABILITY | LIQUIDITY | INVESTMENT ADEQUACY | RISK LEVEL | EQUITY | |
| SOLVABILITY | 1.0000 | 0.4145 | 0.5646 | -0.1498 | 0.5492 |
| LIQUIDITY | 0.4145 | 1.0000 | 0.5992 | -0.0570 | 0.6008 |
| INVESTMENT ADEQUACY | 0.5646 | 0.5992 | 1.0000 | -0.1467 | 0.4652 |
| RISK LEVEL | -0.1498 | -0.0570 | -0.1467 | 1.0 | -0.0946 |
| EQUITY | 0.5492 | 0.6008 | 0.4652 | -0.0946 | 1.0000 |
Source: EViews 9 Output Results
Table 7. Heteroscedasticity Results
| Variable | Coefficient | Std. Error | t-Statistic | Prob. |
| C | 1.6471 | 0.7886 | 2.0886 | 0.0380 |
| SOLVABILITY | 0.0000 | 0.0001 | 0.4475 | 0.6550 |
| INVESTMENT ADEQUACY | -0.0000 | 0.0001 | -0.4467 | 0.6556 |
| LIQUIDITY | 0.0002 | 0.0002 | 0.9121 | 0.3628 |
| RISK LEVEL | -0.0432 | 0.1720 | -0.2515 | 0.8017 |
| EQUITY | -0.0011 | 0.0060 | -0.1937 | 0.8466 |
Source: EViews 9 Output Results
Table 7 shows that in the Probability column (PROB), it can be seen that all independent variables, namely the variables SOLVABILITY, LIQUIDITY, RISK LEVEL, INVESTMENT ADEQUACY, and EQUITY, have a PROB value> 0.05. So, the estimation model did not have a heteroscedasticity problem.
4.3. Hypothesis Testing
The results of hypothesis testing are presented in Table 8 and show that the variables SOLVABILITY, LIQUIDITY, RISK LEVEL, INVESTMENT ADEQUACY, and EQUITY simultaneously have a significant effect on FINANCIAL DISTRESS. So H1 was accepted. Meanwhile, the Adjusted R-squared value of 0.9552 showed the variable SOLVABILITY, LIQUIDITY, RISK LEVEL, INVESTMENT ADEQUACY and EQUITY together can explain the effect on FINANCIAL DISTRESS by 95.52% and the remaining 4.48% was influenced by other factors: outside the variable under study. If the variables SOLVABILITY, LIQUIDITY, RISK LEVEL, INVESTMENT ADEQUACY, and EQUITY were managed properly, then the possibility of financial difficulties in the insurance industry will be smaller and the financial condition was healthy.
Table 8. The test results of the solvability, liquidity, level, risk, investment adequacy, equity effects simultaneously on financial distress
| Hypothesis | Variable | Coefficient | t-Statistic | Prob. | Notes |
| H1 | SOLVABILITY | 0.0003 | 3.7240 | 0.0003 | Hypothesis accepted |
| LIQUIDITY | 0.0005 | 2.7487 | 0.0067 | ||
| RISK LEVEL | 0.0204 | 0.2557 | 0.7985 | ||
| INVESTMENT ADEQUACY | 0.0004 | 3.6784 | 0.0003 | ||
| EQUITY | 0.1175 | 19.1629 | 0.0000 | ||
| R-squared | 0.9651 | ||||
| Adjusted R-squared | 0.9552 | ||||
| F-statistic | 97.6135 | ||||
| Prob (F-statistic) | 0.0000 |
Table 9. The test results of solvability, liquidity, level, risk, investment adequacy, equity effects partially on financial distress
| Hypothesis | Variable | Coefficient | t-Statistic | Prob. | Notes |
| H2 | SOLVABILITY | 0.0012 | 13.8255 | 0.0000 | Hypothesis accepted |
| H3 | LIQUIDITY | 0.0031 | 9.6899 | 0.0000 | Hypothesis accepted |
| H4 | RISK LEVEL | 0.0259 | 0.2536 | 0.8001 | Hypothesis rejected |
| H5 | INVESTMENT ADEQUACY | 0.0018 | 5.9922 | 0.0000 | Hypothesis accepted |
| H6 | EQUITY | 0.1529 | 20.6960 | 0.0000 | Hypothesis accepted |
Source: EViews 9 Output Results
The interpretation of the results in Table 9 states that partially the SOLVABILITY, LIQUIDITY, INVESTMENT ADEQUACY and EQUITY variables have a positive and significant effect on FINANCIAL DISTRESS, while the RISK LEVEL variable has no effect on FINANCIAL DISTRESS. Thus H2, H3, H5 and H6 are accepted and H4 is rejected.
4.4. The Test Results of the Risk Level as a moderator
The basis for knowing whether the Risk Level variable acts as a moderator, will be conducted a moderation test for each independent variable.
Table 10. The test results of solvability, liquidity, investment adequacy, equity effects on financial distress with risk level moderation
| Hypothesis | Variable | Coefficient | t-Statistic | Prob. | Notes |
| H7 |
SOLVABILITY * RISK LEVEL |
-0.0001 | -1.9818 | 0.0492 |
Hypothesis accepted |
| H8 |
LIQUIDITY * RISK LEVEL |
-0.0000 | -0.1710 | 0.8644 |
Hypothesis rejected |
| H9 |
INVESTMENT ADEQUACY * RISK LEVEL |
0.0006 | 2.5902 | 0.0105 |
Hypothesis accepted |
| H10 |
EQUITY* RISK LEVEL |
-0.0098 | -3.2481 | 0.0014 |
Hypothesis accepted |
Source: EViews 9 Output Results
Table 10 shows the Risk Level variable moderates the relationship between solvability, investment adequacy and equity to financial distress; whereas the Risk Level variable did not moderate the relationship between liquidity and financial distress, so that H7, H9 and H10 were accepted, and H8 was rejected.
5. Discussion and Conclusion
5.1.Discussion
This study showed that the indicators of financial health, namelythe solvability, the liquidity, the risk level, the investment adequacy, and the equity are important factors to be monitored, so that the company’s business continuity can be sustained and maintained. The test results of the solvability’s effect on Financial distress in this study were supported by previous research results (Hillary, Nyang’au and Christopher Ngacho, 2018) that showed that the solvability can affect the financial distress.
The test results of the liquidity’s effect on Financial distress in this study were supported by the results of previous research (Farooq, Qamar and Haque, 2018) which was in line with the research of Ong’era (2017) and Nyang’au and Ngacho (2018), showing that healthy liquidity can restore financial distress and liquidity has a positive effect on financial distress. The risk level could not detect the relationship between the financial health and the financial difficulties, so it was necessary to rearrange the description in more detail and specifically by setting a measurement standard for each risk, so that a self-assessment of that risk could meet the results according to the circumstances, while reducing errors in an assessment of the overall risk level.
The equity’s effect in this study was in line with the results of Memba (2013)’s study which stated that equity affects financial distress, where a significant cause of financial difficulties was inadequate capital. Likewise, the research results of Ogachi et al. (2020) showed the current ratio, debt, and working capital ratios were the most significant ratios for predicting bankruptcy. The results of the study which showed that the risk level variable moderated the relationship between solvability and financial distress were in line with the research results of Mogotsinyana et al. (2019) which stated that financial performance and risk management must have a balance to provide company security, where the Risk Level as moderation must have a relationship between financial performance and the company’s financial difficulties, and it was also in line with the research results of Wanjohi et al., (2017) which stated that the application of financial risk management well had a positive correlation with financial performance, and recommends designing more modern risk measurement techniques such as risk value. The results of the research that the Risk Level variable moderated the relationship between the Investment Adequacy and the Financial distress were in line with the research results of Mogotsinyana et al. (2019). Likewise, the Risk Level variable which moderated the relationship between equity and the financial distress was in line with previous research (Mogotsinyana et al., 2019; Wanjohi et al., 2017).
5.2. Conclusion
From the Panel Data Multiple Regression analysis, it can be concluded that simultaneously there was a positive and significant effect of the Solvability, the Liquidity, the Risk Level, the Investment Adequacy, and the Equity on the financial distress in life insurance companies in Indonesia. Meanwhile, there was a partial positive and significant effect of the Solvability, the Liquidity, the Investment Adequacy, the equity to the financial distress, except for the Risk Level that did not affect the financial distress. The Risk Level variable moderated the relationship between the Solvability, the Investment Adequacy, and the equity with the financial distress in life insurance companies in Indonesia. Furthermore, the Risk Level did not moderate the relationship between the Liquidity and the financial distress.
Related to the results of this study, there are some suggestions that are presented as follows:
- The results of this study can be used as a reference for (financial) regulators in making policies and regulations, particularly the financial health regulations of the insurance companies.
- The factors studied in this research, namely Solvability, Liquidity, Risk Level, Investment Adequacy and Equity are factors that need to be considered by insurance companies to maintain their business continuity.
- (Financial) Regulators can use the results of this study to monitor and study the financial health problems of insurance companies associated with the risklevel.
- For further research, the measurement of the level of risk can be developed more rigidly with a more specific measurement standard in accordance with the self-assessment of each type of risk, in order to produce a more measurable level of risk, thus reflecting the actual risk situation in the life insurance company.
---
Author Contributions: Trisnawati Taswin: Conceptualization, Methodology, Software. Data analysis, Writing- Original draft preparation; E. Susy Suhendra: Validation, Reviewing and Editing
Funding: This research received no external funding
Conflicts of Interest: The authors state that they have no conflicts of interest
References
- Al-khatib, H. B. and Al-Horani, A., 2012. Predicting Financial Distress of Public Companies Listed in Amman Stock Exchange, Europen Scientific Journal, 8(15), pp. 1-17.
- Al-Manaseer, S. R. and Al-Oshaibat, S., 2018. Validity of Altman Z-Score Model to Predict Financial Failure: Evidence From Jordan. International Journal of Economics and Finance, 10(8), pp. 181-189.
- Al-Tamimi, H. A., 2012. The Effects of Corporate Governance on Performance and Financial Distress The Experience of UAE National Banks. Journal of Financial Regulation and Compliance, 20(2), pp. 169-181.
- Altman, E., 2002. Financial Ratios, Discriminant Analysis and the Prediction of Corporate Bankruptcy. Journal of Finance, 23(4), pp. 589-609.
- Brigham, E. F. and Daves, P. R., 2003. Intermediate Financial Management. Cengage Learning, South Western.
- Cohen, S., Costanzo, A. and Rossi, F. M., 2017. Auditors and Early Signals of Financial Distress in Local Governments. Managerial Auditing Journal, 32(3), pp. 234-250.
- Fahmi, I., 2011. Analisis Laporan Keuangan. Bandung: Alfabeta.
- Farook, S. and Abeysekara, N., 2018. Influence of Social Media Marketing on Consumer. International Journal of Business and Management Invention, 5(12), pp. 122, 115-125.
- Farooq, U., Qamar, M. A. J. and Haque, A., 2018. A Three Stage Dynamic Model of Financial Distress. Managerial Finance, 44(9), pp. 1101-1116.
- Habib, A., Bhuiyan, M. B. U. and Ainul Islam, A., 2013. Financial Distress, Earnings Management and Market Pricing of Accruals During the Global Financial Crisis. Managerial Finance, 39(2), pp. 155-180.
- Halteh, K., Kumar, K. and Gepp, A., 2018. Financial Distress Prediction of Islamic Banks Using Tree-Based Stochastic Techniques. Managerial Finance, 44(6), pp. 759-773.
- Hillary, O. K., Nyang’au, A. and Christopher Ngacho, C., 2018. Effects of Financial Distress on Financial Performance of Manufacturing Firms Listed in Nairobi Securities Exchange. International Journals of Academics & Research, 1(1), pp. 211-220.
- Hu, D. and Zheng, H., 2015. Does Ownership Structure Affect the Degree of Corporate Financial Distress in China? Journal of Accounting in Emerging Economies, 5(1), pp. 35-50.
- Hu, H. and Sathy, M., 2015. Predicting Financial Distress in the Hong Kong Growth Enterprises Market from the Perspective of Financial Sustainability. Sustainability, 7, pp. 1186-1200.
- Khaliq, A., Altarturi, B.H.M., Thaker, H.M.T., Harun, M.Y. and Nahar, N., 2014. Identifying Financial distress firms: a case study of Malaysia’s government linked companies (GLC). International Journal of Economics, Finance and Management, 3(3), pp. 141-150.
- Kutum, I., 2015. Predicting the Financial Distress of Non-Banking Companies Listed on the Palestine Exchange. Research Journal of Finance and Accounting, 6(10), pp. 79-83.
- Lim, T. C. and Jessica, L., 2012. Bankruptcy Prediction: Theoretical Framework Proposal. International’, Journal of Management Sciences and Business Research, 1(9), pp. 69-74.
- Madhushani, I. K. H. H. and Kawshala, B. A. H., 2018. The Impact of Financial Distress on Financial Performance Special Reference to Listed Non - Banking Financial Institutions in Sri Lanka. International Journal of Scientific and Research Publications, 8(2), pp. 393-404.
- Memba, F., 2013. Causes of Financial Distress: A Survey of Firms Funded by Industrial and Commercial Development Corporatation in Kenya. Research Business Journal, 4(2), pp. 1171-1185.
- Nanayakkar, K. G. M. and Azeez, A. A., 2015. Predicting Corporate Financial Distress in Sri Lanka: An Extension to Z-Score Model. International. Journal of Business and Social Research, 5(3), pp. 41-56.
- Ogachi, D., Ndege, R., Gaturu, P. and Zoltan, Z., 2020. Corporate bankruptcy prediction model, a special focus on listed companies in Kenya. Journal of Risk and Financial Management, 13(3), p.47.
- Ong’era, J. B., 2017. Liquidity as a Financial Antesedent to Financial Distress Nairobi Securities Exchange. Journal of Emerging Issues in Economics, Finance and Banking, 6(1), pp. 2121-2137.
- Oniga, A., 2016. Classic Insolvency Prediction Models Tested On Romanian Insurance Companies. European Scientific Journal, 12(13), pp. 18-28.
- Oz, I. O. and Yelkenci, T., 2017. A Theoretical Approach to Financial Distress Prediction Modeling. Managerial Finance, 43(2), pp. 212-230.
- Parkinson, M. M., 2016. Corporate Governance During Financial Distress - An Empirical Analysis. International Journal of Law and Management, 58(5), pp. 486-506.
- Rianti, I. P. and Yadiati, W., 2018. How Financial Distress Influence By Firm Size. International Journal of Scientific & Technology Research, 7(1), pp. 149-153.
- Salehi, M., Shiri, M. M. and Pasikhani, M. B., 2016. Predicting Corporate Financial Distress Using Data Mining Techniques an Application in Tehran Stock Exchange. International Journal of Law and Management, 58(2), pp. 216-230.
- Samanhyia, S., Oware, K. M. and Yaansah, F. A., 2016. Financial Distress and Bankruptcy Prediction: Evidence from Ghana. Expert Journal of Finance, 4, pp. 52-65.
- Sathyamoorthi, C., Mapharing, M., Mphoeng, M. and Dzimiri, M., 2020. Impact of financial risk management practices on financial performance: evidence from commercial banks in Botswana. Applied Finance and Accounting, 6(1), pp.25-39.
- Sensi, L., 2006. Evaluasi Manajemen Risiko Kantor Akuntan Publik (KAP) dalam Keputusan Penerimaan Klien Berdasarkan Pertimbangan dari Risiko Klien, Risiko Audit dan Risiko Bisnis KAP. Jurnal Akuntansi dan Keuangan Indonesia, 3(2), pp. 191-211.
- Wanjohi, S. M., Wanjohi, J. G. and J.M., N., 2017). The Effect of Financial Risk Management in the Financial Performance of Commercial Banks in Kenya. International Finance and Banking Research, 3(5), pp. 70-81.
- Waqas, H., Md-Rus, R. and Elgammal, M. M., 2018. Predicting Financial Distress: Importance of Accounting and Firm-Specific Market Variables for Pakistan’s Listed Firms. Cogent Economics & Finance, 6(1).
Article Rights and License
© 2022 The Authors. Published by Sprint Investify. ISSN 2359-7712. This article is licensed under a Creative Commons Attribution 4.0 International License.