Keywordsbrand perception branding campus safety higher education student demonstrations
JEL Classification I23, M31
Full Article
1. Introduction
1.1 Study Background
Universities around the world are recognised as the source of intellectual advancement and the breeding ground for the future leaders of tomorrow. They succeed when they are able to deliver knowledge and value. This, however, is jeopardised when they are unable to perform their basic function, namely suppling high-quality education. Over the past several years, student protest action has become an annual occurrence at South African universities. Unmet student demands have led to the protests turning violent, which resulted in injuries to staff members and students and the destruction of property. These actions clearly have the potential to prevent the provision of quality education and can damage the universities’ brands and current and potential students' views and opinions about the institution. These student protests have been attributed to key challenges associated with students coming from impoverished backgrounds and the empty promises made by government officials (Barbeau, 2010). Some of the major concerns expressed by protesting students included the increase of registration fees, inefficiencies of the National Student Financial Aid Scheme (NSFAS) funding, accommodation problems and delayed book allowances (Newman, 2010). Students believe that if they take no action, then the university will not take their complaints seriously. Brandt (2022) reported that a prominent South African University of Technology (hereafter referred to as SAUT to maintain the anonymity of the university) experienced major losses from violent protests which damaged property and compromised the safety of students and staff. Vehicles were burned, the throwing of petrol bombs and attacks on the four SAUT campuses resulted in closure of the university. Protesters violated COVID-19 regulations and traumatised staff who required counselling (Thwala, 2022). According to the SAUT’s branding policy, SAUT is committed to producing graduates who are employable, entrepreneurial and creative and to cater for cultural diversity by superior academic teaching, learning and research. Furthermore, the university vision aims to promote, re-establish and work on being people centric, including ensuring the safety of students and staff and ensuring continuity of the academic programme. Clearly this vision is undermined by continuous protest action that threatens safety and prevents academic activities from taking place, thereby damaging SAUT’s brand image in the eyes of current and potential students.
1.2 Research Problem and Study Objective
An example of a negative image was observed by Pitso (2018) in the SAUT’s Department of Hospitality. SAUT graduates and hospitality staff members felt that the brand image of SAUT had been damaged by a negative perceptions and attitudes toward the hospitality department within the university as well as the hospitality sector in general (Pitso, 2018).
In addition to such localised negative perceptions, SAUT’s history of yearly protests potentially created a negative image of the university as a whole. The Parliamentary Monitoring Group (2022) recommended that the institution adopt a more proactive stance before protests spiral out of control. Numerous studies have been conducted on student protests at SAUT, but only the Pitso (2018) study of the Hospitality and Tourism department assessed the effects on SAUT's reputation. Hence, there is a knowledge gap about the impact of student perceptions, especially of protests, and their potential adverse effects on the reputation of SAUT as a brand. As such, this study explored the reasons why students protest and sought recommendations on how the institution may respond to safeguard the SAUT brand. Thus, the objective of this study was to determine the influence student protests have had on the brand image of SAUT, and thereby to identify possible steps that could be taken to avert student protests or to mitigate their negative effect on SAUT’s brand image.
2. Literature Review
2.1 Introduction
Posastiuc (2013) identified protest as a form of collective action or behaviour as people engage in social interaction and respond to structural ambiguity. Protest action has been part of the political expression in South Africa for decades. Student protest is classified as a form of collective action, with socio-economic, political, and cultural issues being common contributing factors of student protest. Other contributing factors are poor student service, delayed receipt of stipends and the termination of students’ benefits (Postma, 2016).
2.2 Student Protests in South Africa
Many organisations around the world have been subjected to strikes and protests over recent years. Particularly regarding the context of research in South Africa, this reflects the country’s dissatisfied consumers, who are frustrated that their salaries remain the same while the price of essentials keeps rising. Taunyatswala (2014) indicates that protests are an indication of a failure in service delivery. South Africa is known as the “Protest Capital of the World” (Alexander, 2010), a title rooted in the country’s history and ingrained in the collective psyche of many South African citizens. Protests at many universities in South Africa were sparked by calls for free education and clearance of historic debt, known as the ‘Fees must Fall’ movement which started in Cape Town in 2015 (Muller, 2016). The demand for free and decolonised education, when met by mixed signals from the Minister of Education and perceived as rejection, led to violent protests that resulted in loss of learning hours, lack of examination preparation and poor pass rates (Dandara et al., 2017). According to Cornell and Maeng (2020), the current generation of students is exposed to more violence via newspapers, advertisements and social media. Due to this increased exposure, unresponsive management and the police’s often violent response (using rubber bullets to disperse protesters), students in today’s learning institutions are less sensitive to the violence and see it as a legitimate way of emphasising their grievances (Linden, 2017).
The SAUT is one of the educational institutions in South Africa that has become well-known for its ongoing history of yearly protests. Violent protests have taken place because of the annual increases in registration fees, inefficient administration of funding by NFSAS (the government student funding agency), including book allowances, food vouchers and student accommodation funding being delayed. The protests have damaged property (costing the university millions to repair), destroyed teaching resources and disrupted the academic programmes, all of this compromising the safety of students and staff, and contributing to a decrease in academic performance, poor pass rates and an increase in drop-out rate. Lecturers are afraid to continue as they have become victims of protest and feel unsafe in the classrooms (Mushama, 2020). Due to ongoing protests, students, in addition to being academically disadvantaged, are left with traumatic experiences and post-traumatic stress disorders (Dandara et al., 2017). This compromises the lives of the future generation and other studies have indicated that involvement in protest has a subsequent impact on careers (Darren and Sherkat, 1997).
2.3 Student Protest at SAUT
Barbeau (2010) reported that housing and funding concerns were addressed with the Student Representative Council (SRC) at SAUT, who agreed upon actions to address these concerns as far back as 2009. However, in 2010, students’ funding was not forthcoming, and they insisted on being registered even though they would not be able to pay back the funds. Kazmi (2011) indicated that the SRC President requested the university to cancel charges against those students who were arrested for the resulting violent protest and the damaging of university property. Unable to pay back, students wanted SAUT to fund loans worth R35-million to those who qualified for registration in 2014. Kathmandu (2013) state that in the culture of non-repayment, student funding would be a problem as: “It is not advisable to say more funding is required when there is a system of non-repayment”. The university would not be sustainable with an ongoing cycle of non-repayment. These contributing factors probably led to damaging the brand name of the university.
2.4 Brand Image
According to Chandon (2003) and Sultan and Wong (2019), a brand image is defined as a consumer’s perception and belief of a brand reflected in the mind of the consumer. The subjective insight of brand consists of tangible and intangible issues related to the cognitive and emotional evaluations by the consumer. Branding, and especially brand values, norms and symbols, have been shown to have a positive influence on corporate performance in South Africa (Schmidt et al., 2017).
In the context of a university, students develop trust and satisfaction in the institution’s brand over the duration of their studies. Therefore, justifying the relationship between brand image, brand performance, and perceived quality is significant in the context of university branding (Sultan and Wong, 2019). Since higher education has become more globalised, with increased competition and lower government financing, greater emphasis has had to be placed by educational institutions on marketing their programmes and courses. In other words, universities have become business operations with students as their customers. In a system of education, universities are now conceived as business operations that utilise value-marketing performance to establish their brand and attract more students. Marketing a university is complex in that sometimes it is a product and sometimes a service. Students are both the product and the customer (Taylor et al., 2004). As a result, student satisfaction must be considered (Chen, 2016) and positive perceptions help students in making decisions about which educational institution to select for their studies. Perceptions are influenced by, amongst other things, image, branding and reputation (Mason et al., 2018). According to Sultan and Wong (2019:332), branding of universities is classified as a recent marketing tool that aims to attract, retain and engage students as well as positioning universities in the competitive higher education sector. The brand assures students that the education they will receive is a good investment for their future and worth the tuition money (Durban University of Technology, 2021). Student satisfaction may be the deciding element in higher education, instead of academic excellence, further justifying the development of a customer-based brand (Vukasovic, 2015).
2.5 Branding and Universities
Due to demand exceeding supply world-wide, higher education has been moving towards marketization, with a need to identify how universities should carry out their marketing strategies (Becker and Palmer, 2009). Temple (2011) stresses the importance of strong branding, while Park (2009) stressed the importance of symbolic brands (i.e., the importance of brand symbols) to satisfy the personal needs of customers. Since a student may only really appreciate the brand after they have completed the qualification and graduated, or at least experienced a year or two at the university, the decision to study at a particular university often comes about through word of mouth (Chen, 2016). However, the experience during study influences the perception of brand equity by the student which develops customer loyalty and encourages the student to stay longer to complete post- graduate studies at university (Kieran, 2009). Successful branding involves strategic direction, allocation of resources, curriculum development, and hiring of staff and thus influencing its position in the marketplace, which affects the student’s selection decision (Paden and Stell, 2006). However, a lack of resources contributes to students’ not choosing a particular university and results in a poor brand image of the university (Richins, 1983) and students who do not have a positive impression of the university and who are not loyal may create a poor image of the university (Mulyono, 2016).
2.6 Branding and Student Perceptions
The SAUT corporate brand aims to establish the brand in the minds of its stakeholders, to install the perception of the university as being committed to teaching and research excellence, and student conduct excellence (Durban University of Technology, 2021). This requires the university to be ‘student centred’, needing safety and continuity of the academic programme. However, the SAUT Vice Chancellor stated, in an email dated 3 February 2020, that continuous strikes at the SAUT have a negative effect on the image and function of the university. Postma (2016) notes how student protests affect the emotions of students and other interested stakeholders, becoming paranoid about the place where protests occur, and the people involved in the violence and protest. Protests have negatively affected resources at many universities, with some laboratories and libraries were burned down during protests. In higher education, the university brand has to live up to the service promise to help students to achieve the outcomes they desire. The image and reputation of a university brand assists to create the brand equity that attracts and keeps students, which is vitally important in the development of the ‘customer loyalty’ that keeps students studying at the university and also using word-of-mouth to encourage friends and relations to attend the university (Kieran, 2009).
Based on the preceding literature review, the context of the study is summarised by the framework provided in Figure 1.
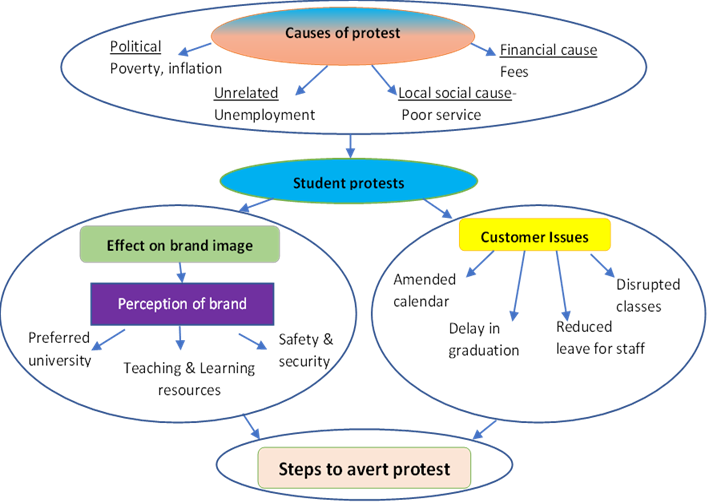
Figure 1: Framework of study
3. Research Methodology
3.1 Overview
This study applied a descriptive research design that took a quantitative approach, with the distribution of 400 questionnaires to obtain relevant data from a non-probability sample. Approximately 25 000 students were the target population in this study. A survey was done within the five faculties based at the three main metropolitan campuses at SAUT.A structured questionnaire with closed ended questions was administered to the sample of students. Analysis of the data used descriptive and inferential statistics (Gingery, 2016).
3.2 Respondents
This sampling technique was a two-step non-probability sampling process. The first step was a quota sample representing the population of five of the six faculties, plus gender. A proportional sample (with a minimum of 80) from each faculty was selected to give a sample size of 400, which allowed for some non-useable responses, but still resulting in the minimum sample as suggested by Sekaran and Bougie (2016). Convenience sampling was used to select the final sample of eighty second- and third-year, 18 years or older, students from each of the five faculties. First-year students were excluded from the study as they are less likely to have experience of student protests and the Faculty of Arts students were excluded as they were situated outside the three main metropolitan campuses where most protest activity takes place. Postgraduate students and in-service training students were also excluded as they are not based on the campuses for the full-time duration of their studies. The sample consisted of quotas of 50% male and 50% female students and 75 % black, 15 % Asian, 5 % coloured and 5 % white students, which are close to the student population proportions.
3.3 Data Collection
The research instrument used in the collection of data was a self-completion questionnaire developed from the literature review, consisting of 27 closed-ended questions with Likert scaled response categories. The instrument was pilot tested by a subject matter expert and a statistician for face and content validity. Minor editing amendments were made before pre-testing with twenty marketing students, similar in profile to the sample profile. Since they were students in the field of marketing, they had some expertise in market research. No changes were needed after the pre-test. Appendix A indicates the literature source of the questions.
The questionnaires were personally administered with the help of a research assistant. The purpose of the study and its relevance were explained to the respondents to facilitate a high response rate, to avoid bias and to ensure receipt of ethics consent. The questionnaires were distributed during lectures with the permission of lecturers in the departments in the five faculties. This data collection process continued until the sample size was reached (Patton, 2001).
3.4 Analysis
The quantitative data was analysed using the Statistical Package for the Social Sciences (SPSS) computer software, version 26. All questionnaires were checked to ensure they complied with the completion requirements and then captured into the SPSS package. Relevant univariate and bivariate statistics, both descriptive and inferential, such as means, standard deviations, t-tests, ANOVA, factor analysis, correlations and multiple regressions were conducted.
3.5 Reliability and Validity
To ensure validity, the questionnaire was subjected to face, content and construct validity testing via a pilot test with two subject matter experts and a statistician, and a pre-test with twenty marketing students similar in profile to the required sample. These tests required some minor structural and grammatical changes to ensure clarity of understanding. Cronbach’s Alpha was used on the pre-test results to initially assess the internal consistency of the questionnaire – all scores were above 0.7 (0.771 to 0.891), as shown in Table 1, and the questionnaire was therefore deemed reliable and fit for the main study.
Table 1: Reliability of pre-test of questionnaire
| Constructs | Cronbach’s alpha | Number of items |
| Protest experience | 0.771 | 9 |
| Perceived image | 0.849 | 10 |
| Branding | 0.831 | 7 |
| Customer satisfaction | 0.875 | 6 |
| Fees | 0.891 | 5 |
4. Analysis and Results
4.1 Demographic Profile of the Sample
This section details the socio-demographic characteristics of the respondents. The profile of age, gender, ethnicity, level of study and faculty of the sample is presented in Table 2. The comparison of the gender and faculty samples against the population (SET and SSH = see Table 2 *) indicates a good representation by the sample of the SAUT student population. The ethnic composition is skewed against black students, which was necessary to enable sample sizes for the other main ethnic groups to be statistically meaningful and useable (Allen, 1982). Regarding the other demographic categories (age, level of study, SAUT as first choice), it can be seen that they provide a reasonable spread across the response categories, providing sub-categories that are sufficiently large to enable satisfactory analysis (Allen, 1982).
Table 2: Profile of sample
| Socio-demographic | Sample | Population % | ||
| f | % | Grouped % | ||
| Gender | ||||
| Male | 184 | 45.8 | 46 | |
| Female | 213 | 53.0 | 54 | |
| Diverse/Other/Not specified | 5 | 1.2 | ||
| Age | ||||
| 18-20 | 78 | 19.4 | ||
| 21-23 | 145 | 36.1 | ||
| 24-26 | 128 | 31.8 | ||
| 27-29 | 40 | 10.0 | ||
| 30 and above | 11 | 2.7 | ||
| Ethnicity | ||||
| African | 243 | 60.5 | 90 | |
| White | 24 | 6.0 | 1 | |
| Indian | 97 | 24.1 | 7 | |
| Coloured | 37 | 9.2 | 1 | |
| International/Other | 1 | 0.2 | 1 | |
| Level of study | ||||
| 2nd year | 105 | 26.1 | ||
| 3rd year | 134 | 33.3 | ||
| 4th year | 134 | 33.3 | ||
| 5th year | 29 | 7.2 | ||
| Faculty | ||||
| Engineering & Built Environment | 52 | 12.9 | 41.5 (SET)* | 40 (SET)* |
| Applied Sciences | 115 | 28.6 | ||
| Management Sciences | 121 | 30.1 | 58.5 (SSH)* | 60 (SSH)* |
| Accounting & Informatics | 74 | 18.4 | ||
| Health Sciences | 40 | 10.0 | ||
| SAUT was first choice/option | ||||
| Yes | 217 | 54.0 | ||
| No | 185 | 46.0 | ||
| * SET = Science, engineering, technology SSH = Social sciences and humanities | ||||
4.2 Reliability and validity
The internal reliability of the component variables, consisting of experience of student protest, image perceived by SAUT students, university branding, customer satisfaction and fees, was tested using Cronbach's Coefficient Alpha. The results are provided in Table 3, showing that all dimensions scored above the suggested 0.7 for a reliable instrument, and overall, above 0.8 (Taber, 2018).
Table 3: Cronbach’s coefficient alpha
| Dimensions | Items | Cronbach’s alpha |
| Experience of student protest | 6 | 0.713 |
| Image perceived by SAUT students | 13 | 0.735 |
| University Branding | 7 | 0.703 |
| Customer satisfaction | 6 | 0.701 |
| Fees | 3 | 0.734 |
| Total | 35 | 0.810 |
In an attempt to further validate the constructs, factor analysis was performed using exploratory factor analysis (EFA) and confirmatory factor analysis (CFA). According to Shrestha (2021), for factor analysis to be carried out, the Kaiser-Meyer value should exceed the value of 0.5 and Bartlett’s Test of Sphericity must be statistically significant. The data in Table 4 show that these requirements have been met.
Table 4: KMO and Bartlett's Test for the constructs
| Kaiser-Meyer-Olkin Measure of Sampling Adequacy. | 0.789 | |
| Bartlett's Test of Sphericity | Approx. Chi-Square | 3852.745 |
| df | 595 | |
| Sig. | 0.000 | |
An EFA analysis was conducted, making use of the principal component analysis (PCA) extraction method and Varimax rotation. Using eigenvalues greater than one, the PCA for the extracted items revealed ten factors explaining 59.9% of the total variance. To validate the emerged constructs, confirmatory factor analysis (CFA) was computed. Unfortunately, only two of the factors, University branding and Fees, had acceptable reliability. The validity of the dimensions was assessed using both convergent and discriminant validity. The convergent validity was assessed using the average variance extracted (AVE), which requires a standardised factor loading with a value of 0.50 or higher (Hair et al., 2014). All ten emergent factors failed convergent validity as all the AVE measures were less than 0.5. Furthermore, the AVE of only two factors’ (Fees and Customer orientation) had adequate discriminant validity as the MSV values measured were less than the AVE (Mimouni-Chaabane and Volle, 2010). Therefore, since the CFA results failed to support the validity of the emerging constructs a decision was taken to continue the analysis of the findings relative to the research objectives that were structured according to the constructs developed from the literature review.
4.3 Descriptive Statistics
This section details the responses gathered from the respondents’ completed questionnaires. Positive statements (strongly agree and agree) were conflated as agreement, while negative statements (disagree and strongly disagree) were conflated as disagreement. The mean value was used to show the level of agreement or disagreement. A one-sample t-test was applied to determine if the agreement or disagreement with each statement was statistically significant.
The average agreement/disagreement score was tested against the central score of ‘3’ to determine if it is significantly different from ‘3’ - all results were statistically significant (p < 0.05). These descriptive results are presented in Table 5.
Table 5: Descriptive statistics of questions
| Dim | Question | Mean (SD) |
|
Experience of protest |
Affects the brand reputation of SAUT | 4.17 (0.859) |
| Protests lead to the adjustment of the academic calendar and delays completion of lectures, syllabus and diploma | 4.17 (0.840) | |
| Violent student protest places my life in danger | 4.11 (0.846) | |
| Increases student dropout rate | 3.92 (1.027) | |
| Emerged as a result of lack of funds, book allowances, housing | 4.28 (0.816) | |
| Costs the university to repair and replace broken equipment and fixtures | 4.42 (0.783) | |
| Perceived image by students | Student protest damages the SAUT’s brand image | 4.26 (0.852) |
| Students protest about matters/resources not managed by SAUT | 3.96 (1.082) | |
| The university cares about student & staff safety during protests | 3.63 (1.157) | |
| SAUT has enough teaching, learning & financial facilities/resources | 3.79 (.991) | |
| Negative publicity/word of mouth influences university branding & choice of varsity | 4.21 (.740) | |
| SAUT’s brand image increases student enrolment / retention | 4.11 (.771) | |
| SAUT is a preferred university of technology in KZN | 3.86 (.854) | |
| Gender based violenceaffects SAUT’s brand image | 3.76 (.921) | |
| Violence in protests creates fear amongst staff/students at SAUT | 4.28 (.763) | |
| Social media communication contributes to the brand image of university | 4.29 (.740) | |
| Changes of managerial staff influence university’s overall performance | 4.11 (.890) | |
| Resistance to change affects overall performance & varsity brand image | 4.21 (.861) | |
| Student behaviour in protests influences perception & quality of education | 4.03 (1.009) | |
| University branding | Effective advertising creates brand awareness & impacts choice of varsity | 4.19 (0.808) |
| SAUT’s choice of media for advertising is very effective | 3.86 (0.806) | |
| SAUT’s brand is trustworthy | 3.88 (0.856) | |
| Competition among KZN varsities forces technological development of facilities | 4.03 (0.765) | |
| SAUT created a brand image in minds of public, when compared to similar universities | 3.92 (0.828) | |
| Brand awareness at private varsities is more effective than public varsities | 3.96 (0.868) | |
| First year students lack experience to rank a university in SA | 4.17 (0.899) | |
| Customer orientation | The university is both a product and a service | 4.09 (0.808) |
| Intend to continue with my studies at SAUT (Post graduate level) | 4.05 (0.782) | |
| Without quality education, a university will not retain students | 4.26 (0.688) | |
| To establish the university as student centred requires safety facilities and continuity of the academic programme | 4.28 (0.683) | |
| Student satisfaction with the varsity is related to academic achievement | 4.25 (0.762) | |
| The university qualification is appropriate for the world of work | 4.05 (0.836) | |
| Fees | The university fees are affordable compared to other universities | 3.42 (1.160) |
| NFSAS loans must be repaid by graduates upon completion | 3.33 (1.252) | |
| SAUT offers a payment plan to suit me | 3.15 (1.356) |
As shown in Table 5, the mean values measured for all statements were above 3. This suggests that there is a considerable agreement with these statements, with all being statistically significant (p<0.001). Aggregating the questions for each of the constructs and conducting a one-sample t-test produced the findings as shown in Table 6.
Table 6: Descriptive statistics for aggregated constructs
| T value | Sig 2-Sided p | Mean | Std dev | 95% Confidence Interval | ||
| Lower | Upper | |||||
| Experience of protest | 150.988 | .000 | 4.18 | 0.555 | 4.1235 | 4.2323 |
| Perceived image by students | 183.097 | .000 | 4.04 | 0.442 | 3.9959 | 4.0826 |
| University branding | 160.496 | .000 | 4.00 | 0.500 | 3.9521 | 4.0501 |
| Customer orientation | 173.029 | .000 | 4.16 | 0.482 | 4.1160 | 4.2107 |
| Fees | 65.068 | <.001 | 3.30 | 1.017 | 3.2005 | 3.3999 |
The means shown in Table 6 indicate that for all constructs, except fees, there is a fairly strong level of agreement by the majority of respondents, with scores of above 4 and relatively low standard deviations of around, or close to, 0.50. The construct fees, however, reflects considerable disagreement, indicating the large number of students are dissatisfied with issues relating to fees and payment.
4.4 Relationships amongst the Study Constructs
Pearson correlation was used to analyse the association existing among the five study constructs: experience of student protest, image perceived by the students, university branding, customer satisfaction, and fees, as shown in Table 7.
Table 7: Correlation among the constructs
| Student protest | Image perceived | University Branding | Customer orientation | Fees | ||
| Student protest | Pearson Corr | --- | ||||
| Sig. (2-tailed) | ||||||
| N | ||||||
| Image perceived by respondents | Pearson Corr | 0.456** | --- | |||
| Sig. (2-tailed) | 0.000 | |||||
| N | 402 | |||||
| University Branding | Pearson Corr | 0.090 | 0.330** | --- | ||
| Sig. (2-tailed) | 0.072 | 0.000 | ||||
| N | 402 | 402 | ||||
| Customer orientation | Pearson Corr | 0.250** | 0.225** | 0.205** | --- | |
| Sig. (2-tailed) | 0.000 | 0.000 | 0.000 | |||
| N | 402 | 402 | 402 | |||
| Fees | Pearson Corr | 0.189** | 0.146** | - 0.085 | 0.110* | --- |
| Sig. (2-tailed) | 0.000 | 0.003 | 0.090 | 0.028 | ||
| N | 402 | 402 | 402 | 402 | ||
| * Correlation is significant at 0.05 level (2-tailed). ** Correlation is significant at 0.01 level (2-tailed). | ||||||
The correlation matrix shows a moderately positive relationship between experience of student protests and SAUT’s perceived image (0,456; p<.000), clearly suggesting that this image is influenced by protest action. Furthermore, the attitudes to university branding and the perceived image also reflected a moderately positive relationship (0,330; p<.000). Relationships between the other constructs were all weak and positive, except for university branding and fees which was very weak, negative (-0.085; p<.000), indicating that the tentative attitudes to, and knowledge about fees and payments, might have a slightly negative impact on students’ perceptions of SAUT (Ratner, 2009).
4.5 Relationship between Demographic Variables and Study Constructs
The relationship between the respondent's demographic characteristics, namely gender, age, ethnicity, level of study, and faculty, and the constructs, namely experience of student protest, perceived image, university branding, customer orientation, and fees, was investigated using a one-way Analysis of Variance (ANOVA).
The results are presented in Table 8. Because number of respondents in Diverse/other in gender, and International in ethnicity, categories were so small, these respondent types are not discussed.
Table 8: Association between socio-demographic factors and constructs
| Socio-demographic | Experience of protests | Image perceived | University branding | Customer satisfaction | Fees |
| M (SD) | M (SD) | M (SD) | M (SD) | M (SD) | |
| Gender | |||||
| Male | 4.11 (0.64) | 3.99 (0.46) | 4.00 (0.51) | 4.13 (0.50) | 3.21 (1.04) |
| Female | 4.23 (0.46) | 4.07 (0.43) | 4.00 (0.49) | 4.19 (0.47) | 3.39 (0.99) |
| Diverse/Other/Not specified | 4.50 (0.35) | 4.35 (0.20) | 4.09 (0.81) | 4.47 (0.27) | 2.80 (0.73) |
| Sig. | 0.030** | 0.050 | 0.912 | 0.182 | 0.123 |
| Age group | |||||
| 18-20 | 4.14 (0.60) | 4.07 (0.47) | 4.09 (0.54) | 4.10 (0.59) | 3.12 (1.10) |
| 21-23 | 4.14 (0.59) | 4.03 (0.44) | 4.02 (0.52) | 4.13 (0.52) | 3.18 (1.03) |
| 24-26 | 4.19 (0.54) | 4.03 (0.47) | 3.94 (0.46) | 4.21 (0.40) | 3.33 (0.94) |
| 27-29 | 4.28 (0.41) | 4.05 (0.31) | 4.00 (0.45) | 4.25 (0.39) | 3.83 (0.86) |
| 30 and above | 4.47 (0.22) | 4.01 (0.28) | 3.81 (0.49) | 4.18 (0.35) | 3.88 (0.95) |
| Sig. | 0.231 | 0.948 | 0.164 | 0.336 | 0.001*** |
| Ethnicity | |||||
| African | 4.12 (0.60) | 3.97 (0.47) | 3.94 (0.51) | 4.13 (0.51) | 3.24 (0.97) |
| White | 4.24 (0.46) | 4.29 (0.34) | 4.29 (0.37) | 4.28 (0.33) | 2.89 (1.29) |
| Indian | 4.30 (0.46) | 4.13 (0.36) | 4.00 (0.46) | 4.18 (0.44) | 3.44 (1.03) |
| Coloured | 4.18 (0.46) | 4.13 (0.36) | 4.19 (0.55) | 4.27 (0.45) | 3.56 (1.00) |
| International | 4.33 (0.00) | 3.92 (0.00) | 4.14 (0.00) | 4.17 (0.00) | 4.33 (0.00) |
| Sig. | 0.095 | 0.000*** | 0.002*** | 0.366 | 0.040** |
| Level of study | |||||
| 2nd | 4.10 (0.53) | 3.96 (0.50) | 4.00 (0.52) | 4.10 (0.52) | 3.06 (1.04) |
| 3rd | 4.11 (0.57) | 3.99 (0.45) | 3.91 (0.51) | 4.16 (0.43) | 3.32 (0.95) |
| 4th | 4.28 (0.56) | 4.12 (0.39) | 4.07 (0.47) | 4.19 (0.51) | 3.47 (0.99) |
| 5th | 4.26 (0.47) | 4.24 (0.32) | 4.13 (0.49) | 4.35 (0.39) | 3.27 (1.20) |
| 5th + | 4.56 (0.63) | 3.97 (0.29) | 4.05 (0.59) | 3.89 (0.19) | 3.22 (1.58) |
| Sig. | 0.029** | 0.004*** | 0.072 | 0.124 | 0.046** |
| Faculty | |||||
| Manage Sciences | 4.16 (0.60) | 4.03 (0.53) | 4.00 (0.59) | 4.19 (0.50) | 3.05 (1.23) |
| Engineering & Built Environ | 4.14 (0.40) | 4.07 (0.35) | 4.01 (0.48) | 4.24 (0.46) | 3.27 (0.86) |
| Applied Sciences | 4.19 (0.55) | 4.04 (0.44) | 4.05 (0.44) | 4.19 (0.42) | 3.46 (0.96) |
| Acct & Informatics | 4.12 (0.66) | 3.99 (0.37) | 3.86 (0.45) | 4.02 (0.55) | 3.45 (0.90) |
| Health Sciences | 4.33 (0.35) | 4.09 (0.39) | 4.12 (0.49) | 4.16 (0.48) | 3.38 (0.71) |
| Sig. | 0.395 | 0.788 | 0.058 | 0.073 | 0.017** |
In terms of the respondents' gender, the results in Table 7 reveal that there are no significant differences in the views on the image perceived, university branding, customer orientation and fees (P>0.05). There was, however, a statistically significant difference in the experience of student protest (P=0.030). The mean measured for female respondents was higher when compared to males. This suggests that the female respondents agreed more with the statements measuring the experience of student protest, which could be indicative of a greater awareness of, or maybe a greater feeling of threat from, student protests.
In terms of age, there are no differences in the respondents' views on experience of student protest, Image perceived by students, University branding, and customer orientation (P>0.05). There was, however, a very high significant difference measured for fees (P=0.001). The highest mean values measured were for the age group 30 and above, decreasing to the lowest value for the 18-20 age group. Since agreement increases with age, older respondents agreed more with the fees statements than those who were younger. This could imply that older students, i.e., those with more experience at the SAUT, have more knowledge about fee or payment issues, or are not as influenced by these issues, for example, not as many older students may be dependent on NSFAS funding.
In terms of ethnicity, the findings suggest that there are no differences in the respondents' views of two of the constructs namely, experience of student protest and customer orientation (P>0.05). The views of the respondents, however, do differ significantly with respect to the image perceived (p<0.001), university branding (P=0.002), and fees (P=0.040). White students agreed most strongly with the statements measuring image perceived and university branding, while White black respondents agreed the least with these statements. This could be because black students may be more negatively influenced by issues like protests and funding problems and so perceive the SAUT more negatively and are not as exposed to the positive aspects of the SAUT brand. Regarding the fees construct, white students agreed the least while Indian and coloured respondents agreed the most, although still quite low. This result may be due to the probability that white students are less reliant on NSFAS funding or SAUT payment schemes.
In terms of the respondents' level of study, the measured values indicate no differences in the respondents' views on two of the constructs, namely, university branding and customer orientation (P>0.05)., but significant differences with respect to experience of student protest (P=0.029), image perceived (P=0.004), and fees (P=0.046). The longer the students have been at the SAUT (i.e., 5th versus 2nd year) the greater the agreement with the statements about experience of student protest (M=4.56±0.63) and with the statements measuring image perceived (M=4.24±0.32) (although agreement drops for 5th year students, possible because as post graduate students, they are more removed from the day-to-day, on-campus, university and tuition issues). Although statistically significant, the scores for fees are much the same for all levels except 2nd years. This may be because second years are more reliant on NSFAs funding, SAUT payment systems and are still coming to terms with payment and administrative procedures.
Finally, in terms of the respondents' faculty, the findings suggest that there are no differences in the respondents' views in four of the constructs, namely, experience of student protest, image perceived, university branding, and customer orientation (P>0.05). The views of the respondents, however, do differ significantly with respect to the fees construct (P=0.017). The mean value for four of the faculties were not that different (3.27 to 3.46), but the score for Management Sciences was considerably lower (3.05), indicating that Management Sciences students possibly experience more difficulties with fees and payments. This could be due to these students being more reliant of NSFAS funding (which is often received late) or because the faculty is not as efficient as other faculties in processing loans, payments or bursaries.
5. Discussion and Implications
Supporting the finding of Newman (2010) and Postma (2016), this study agrees that the primary causes of student protests at the SAUT are funding, accommodation, and lack of resources, all reflecting the unresponsive attitude by management, but ultimately implying government’s unfulfilled promises, as mentioned by Barbeau (2010). The majority of respondents felt that the image and reputation of the university was damaged by student protest, which contributes to the negative perception and quality of education at the SAUT, which supports the findings of Pitso (2018). Furthermore, results reflect that the student protests disrupt learning, and the daily operations at the SAUT, while student protests also increase the dropout rate due to fear of the uncomfortable protest environment. This supports the findings of Dandara et al., (2017). Like the finding of Mushama (2020) that victims of protest feel unsafe in the classroom, this study found that some respondents feel that the SAUT does not care about staff and student safety during protests, which supports previous research that protests result in traumatized staff and students (Thwala, 2022); Dandara et al., 2017) and effects the future careers of students (Darren and Sherkat, 1997).
Previous research into student protests has mostly treated protesters, victims, research participants, etc. as homogeneous. In other words, research has not considered socio-demographic factors as possible variables to be studied. Viewing socio-demographic factors as independent variables is one of the unique contributions of this study. Although the regression analysis showed that the variances in the research constructs (experience, image, branding, customer satisfaction, fees) are only slightly influenced by the socio-demographic factors (age, gender, ethnicity, level, faculty), there are some significant influences by selected socio-demographic factors on individual constructs. There is a significant difference in experience of protests according to gender, with females scoring higher than males. This could be because females may feel more threatened by males in a protest scenario. Lower levels of students tend to score significantly lower than the higher levels on perceptions of image, possibly because the longer a student is at the SAUT, the more they know and understand about the university. Age has a negative significant relationship with university branding, younger students tend to agree more with the statements than older students, possibly because they have more recently paid attention to the SAUT’s branding efforts, for example when selecting a university. Customer satisfaction is negatively and significantly related to Faculty, possibly due to differing locations influencing their exposure to the protests, or to the differing natures or efficiencies in the faculties. Engineering and the Built Environment scored highest, and Accounting and Informatics scored lowest. Finally, perceptions of fees were significantly influenced by age, with younger students agreeing least and older students agreeing most with the statements. This could be because the younger students are probably most negatively affected by problems with NSFAS funding. Since most previous research has not considered socio-demographic factors, it can be assumed that these researchers viewed such factors as non-relevant, which seems to be supported by this study’s finding that socio-demographic factors generally have little influence on the variance in the study constructs.
From all the findings from the study, it seems that more intervention is required from the SAUT management and external stakeholders to resolve student demands and to minimize the negative effects of student protests, thus improving student satisfaction, as suggested by Chen (2016). Student protests generate a lot of negative publicity, but there seems to be a dearth of positive publicity and knowledge about the SAUT and its brand image. The available literature and publicity describe an unsafe environment for SAUT students and staff despite the SAUT’s new branding policy that stresses promoting, re-establishing and working on being people-centric, especially with regard to ensuring the safety of students and staff and ensuring continuity of the academic programme. Despite this” people-centric” policy, the responses reflect that students and staff are left traumatised from their protest experiences and many are no longer comfortable at the SAUT during protests. Therefore, this study identifies the necessity for strong marketing and branding activities as implied by Vukasovic (2015), Mason et al. (2018) and Sultan and Wong (2019), especially considering that the decision to choose a university is strongly influenced by word-of-mouth (Chen, 2016).
6. Conclusion
6.1 Summary of Findings
Important overall findings were that the majority of students believe that protest damages the brand reputation of the university, that the causes of protest are problems with funding, housing and allowances, that students feel their lives are in danger due to violence during protests, and that students and staff feel the campus environment is unsafe. These negative images are further reinforced by the fact that less than two-thirds of respondents believe that the university cares about the safety of students and staff, only about two-thirds of respondents felt that the SAUT has sufficient resources and that the SAUT was their preferred university.
Less than two-thirds of respondents feel that the SAUT brand is trustworthy and that it creates a positive image in the minds of students. Similarly, only two-thirds of respondents believe that the SAUT’s media advertising is effective. Clearly the SAUT’s marketing and branding leaves much to be desired.
Regarding financial issues, only about half the respondents feel that the SAUT fees are affordable, and few understand the SAUT payment plan or agree that it suits their needs. Even worse, less than half of the respondents believed that loans needed to be repaid. This indicates that, and maybe explains why, fees are a contentious issue. Clearly there is a communication problem with students at the SAUT.
6.2 Recommendations for Practice
According to the findings in this study, there exist knowledge gaps in the areas of fees and the trustworthiness of the SAUT brand. Only 44 percent of respondents agreed with the statement that loans must be repaid. This could indicate that more than half of the respondents were not aware that they were liable for loan repayments. As such, students should get a clear indication from the finance department that loans should be repaid. This will assist in the upgrading of the university, repairing broken equipment and vandalised property. Regarding the statement, “SAUT’s brand is trustworthy”, only 62 percent agreed that the brand is trustworthy, which implies that many students may not believe a statement like “SAUT is student-centred”, or believe promises made by management when negotiating with students. Regarding the statement “SAUT has a payment plan to suit me”, only 46 percent of respondents agree that the SAUT has a suitable payment plan. This could suggest that the respondents are unaware of the affordability and payment plan options available at the SAUT, or at other universities so as to judge if the SAUT’s plans are good or not. These indicators could suggest that there is a lack of communication between the staff, students and possibly the government (Department of Higher Education and NSFAS). Also, regarding ongoing protest, the university should be involved with obtaining tighter security measures to make sure the fixtures and property are not tampered with as this has an implication on the university’s resources and facilities on campus, and ultimately on the financial well-being of the university. The institution should keep the government informed of its commitments and recommendations. The university students' lives are being negatively impacted by the absence of such communication and engagement.
6.3 Limitations and Further Research
The study was restricted to the university’s metropolitan-based campuses only, to the brand image of the SAUT only, and respondents were restricted to SAUT students only. Data collection took place during the COVID-19 epidemic with students engaged in online learning. This caused the data collection process to be delayed and possibly may have biased the achieved sample, although the profile illustrated in Table 2 suggests a reasonably representative sample.
Since the study was based only on the SAUT, the results probably should not be generalised to other higher learning institutions. Therefore, further research needs to be conducted via a comparative analysis with other universities to ascertain if other institutions are similarly affected by student protests and whether such protests also impact their brand images in the same way. The results suggest that student protest does negatively impact the brand image of the university, and so further in-depth research on this is warranted – for example, qualitative research into a better understanding of students’ feelings resulting from protests and the resulting feelings towards their universities. Expanded research into other universities and their protest experiences will broaden the knowledge on this topic and provide better insight and suggestions for other universities to cope with student protests. Furthermore, further research at other universities will help to understand the impact and the importance of protest action on the brand image and reputation of universities from a less parochial point of view, allowing findings to be more safely generalised.
---
Author Contributions: SA - Conceptualization, literature review, methodology, formal data collection and analysis, funding acquisition, project administration; RBM – methodology, validation, writing - original draft preparation, visualization, writing – review and editing, supervision; MM - Conceptualization, literature review, funding acquisition, supervision. project administration
Funding:This research was partially funded by a Durban University of Technology post graduate bursary.
Conflicts of Interest: The authors state that they have no conflicts of interest.
References
- Alexander, P. 2010. Rebellion of the poor: South Africa’s service delivery protests – a preliminary analysis. Review of African Political Economy, 37(123), pp. 26-27. http://dx.doi.org/10.1080/03056241003637870
- Allen, J.C. 1982. Learning about Statistics. Johannesburg: MacMillan.
- Andrews, J.C. and Shimp, T.A. 2017. Advertising, promotion, and other aspects of integrated marketing communications. Mason, OH: Cengage Learning.
- Barbeau, N. 2010. DUT undertakes to resolve students’ issues to resolve varsity strike. The Daily News, p. 1. [online] Available at: https://www.proquest.com/docview/431084151/fulltext/27EC727B6C1B4312PQ/1?accountid=10612 [Accessed on 5 July 2023].
- Bawa, A. 2014. Perspectives of student affairs in South Africa. Somerset West: African Minds. [online] Available at: http://www.africanminds.co.za/wp-content/uploads/2014/06/African-Minds-Perspectives-on-Student-Affairs-Web.pdf [Accessed on 05 June 2023 ].
- Becker, C. and Palmer, S. 2009. Branding in universities: identity versus image: a case of a Swedish University. Masters: Marketing and E-Commerce, Lulea University of Technology, Sweden.
- Brandt, K. 2022. DUT says student protests sparked by political, socio-economic interests. EWN Eyewitness News, 2 March. [online] Available at: https://ewn.co.za/2022/03/02/dut-says-recent-student-protests-sparked-by-political-socio-economic-interests [Accessed on 2 October 2022].
- Chandon, P. 2003. Note on measuring Brand awareness, Brand image, Brand Equity and Brand value. INSEAD Faculty & Research Working Paper 2003/19/MKT. [online] Available at: https://flora.insead.edu/fichiersti_wp/inseadwp2003/2003-19.pdf
- Chen, C. 2016. The investigation on brand image of university education and students’ word-of-mouth behaviour. Higher Education Studies, 6(4), pp. 23-25. DOI:10.5539/hes.v6n4p23
- Cornell, D. and Maeng, J. 2020. Student threat assessment as a safe and supportive prevention strategy, final technical report. Washington D.C: US Department of Justice. Retrieved from: https://www.ojp.gov/pdffiles1/nij/grants/255102.pdf
- Czerniewics, L., Trotter, H. and Haupt, G. 2019. Online teaching in response to student protests and campus shutdowns: academics’ perspectives. International Journal of Education Technology in Higher Education, 16(43), pp. 1-22. https://doi.org/10.1186/s41239-019-0170-1
- Dandara, C., Chimusa, E.R. and Wonkam, A. 2017. South African protest 2015, 2016: The aftermath viewed though medical science honours students at the University of Cape Town: South African Medical journal, 107(9), pp. 1- 2. doi:10.7196/SAMJ.2017.v107i9.12714.
- Darren, E. and Sherkat, T. 1997. Explaining the political and personal consequences of protest. Social Forces, 75(3), pp. 1049-1070. https://doi.org/10.2307/2580530
- Duncan, J. 2016. Why student protests in South Africa have turned violent. The conversation, 29 September. [online] Available at: https://theconversation.com/why-student-protests-in-south-africa-have-turned-violent-66288 [Accessed on 15 December 2023].
- Durban University of Technology. 2021. Brand guidelines (Corporate Design Manual V1). 22 January, Division of Corporate Affairs. [online] Available at: https://www.SAUT.ac.za/wp-content/uploads/2014/10/SAUT-Revised-Brand-Feb-2021.pdf. [Accessed on 12 September 2022].
- Fomunyam, K.G. 2017. Student protest and the culture of violence at African Universities: an inherited ideological trait. Yesterday and Today, 17(1), pp. 38-63. http://dx.doi.org/10.17159/2223-0386/2017/n17a3.
- Gingery, T. 2016. C Event. Survey Data Analysis: Descriptive vs inferential statistics (blog).
- Hair, J., Black, W., Babin, B. and Anderson, R. 2014. Multivariate data analysis, 7th ed. Upper Saddle River: Pearson Prentice Hall
- Hanaysha, J., Kumar, D. and Hillman, H. 2012. Service quality and satisfaction: study on international students in universities of North Malaysia. International Journal of Research in Management, 3 (2), pp. 116-133.
- Karamoko, J. 2011. Community protests in South Africa: trends, analysis and explanations. Retrieved from: http://www.cogta.fs.gov.za/wp-content/uploads/2012/01/Community_Protests_SA.pdf [Accessed on 24 February 2022].
- Kathmandu, R. 2013. Education strike continues into the second day. Himalayan Times, March 4, p. 1-2.
- Kazmi, S.K. 2011. Strikes and holidays affect education. Pakistan & Gulf Economist, 30(45), pp. 58-60.
- Kennedy, K.D. 2021. School violence and its impact on student academic achievement. Doctor of Education P-20 and Community Leadership thesis, Murray State University, USA. [online] Available at: https://digitalcommons.murraystate.edu/etd/203 [Accessed on 10 February 2023].
- Kieran, C. 2009. Building customer-based brand equity in higher education: Applying brand equity theory to an international higher education marketing context. Masters: Marketing. Lund University, Sweden. [online] Available at: https://lup.lub.lu.se/luur/download?func=downloadFile&recordOId=1437358&fileOId=2435540 [Accessed on 5 June 2021].
- Klopper, H.B. and North, E. 2011. Brand Management. Cape Town: Pearson Education.
- Lancaster, L. 2014. Getting to the bottom of what really drives public violence in South Africa. [online] Available at: https://issafrica.org/iss-today/getting-to-the-bottom-of-what-really-drives-public-violence-in-south-africa [Accessed on 01 September 2022)
- Linden, M.M. 2017. Narrating the 2015 Fees must fall movement: explanation contesters, and forms of meaning - making in the public sphere. Master of Arts., University of Pretoria. URI: http://hdl.handle.net/2263/65570
- Mason, R.B., Mbambo, S.N. and Pillay, M.A. 2018. Service quality at technical and vocational education and training colleges: Perception according to demographic factors. Journal of Technical Education and Training, 10(1), pp. 15-29.
- Mimouni-Chaabane, A., and Volle, P. 2010. Perceived benefits of loyalty programs: Scale development and implications for relational strategies. Journal of Business Research, 63(1), pp. 32-37. DOI: 10.1016/j.jbusres.2009.01.008
- Muller, S.M. 2016. South Africa’s #fees must fall protests: some inconvenient truths. The Conversation, October 31. [online] Available at: https://theconversation.com/south-africas-feesmustfall-protests-some-inconvenient-truths-67516 [Accessed on 4 November 2021].
- Mulyono, H. 2016. Brand awareness and brand image of decision making on university. Jurnal Manajemen dan Kewirausahaan, 18(2), pp. 163-173. DOI: 10.9744/jmk.18.2.163–173
- Murphy, R. and Pasque, P. 2005. The intersections of living-learning programs and social identity as factors of academic achievement and intellectual engagement. Journal of College Student Development, 46(4), pp. 429-442. DOI:10.1353/csd.2005.0041
- Mushama, T. 2020. Violent community protests and their impact on teachers: A case study of Vuwani, Limpopo Province. Masters of Socio-Education., University of South Africa. URI: http://hdl.handle.net/10500/27741
- Mustafizur., R. Rouf, A. and Uddin, M. 2016. Students’ satisfaction and service quality of HEIs. International Journal of Academic Research and Business and Social Sciences, 6(5), pp. 2222-6990. DOI: 10.6007/IJARBSS/v6-i5/2155
- Naicker, C. 2016. From Marikana to #feesmustfall: The Praxis of Popular Politics in South Africa. Urbanisation, 1(1), pp. 53–61. DOI: 10.1177/2455747116640434
- Ndlovu, S. 2011. Extra security called to keep the peace at SAUT: The Mercury, 11 August. 11, p. 3.
- Newman, L. 2010. DUT students protest for aid for tuition fees. The Mercury (online), 17 August. [online] Available at: http://.search.proquest.com/docview/431034802 [Accessed on 8 September 2023].
- Nwafor, C.U. 2016. Factors influencing protests in the Mbizana Municipality. Masters: Public Management., Durban University of Technology. DOI: https://doi.org/10.51415/10321/1570
- Paden, N. and Stell, R. 2006. Branding options for distance learning programmes. Managing the effect on university image. International Journal of Instructional Technology and Distance Learning, 3(8), pp. 1-58.
- Park, S.E. 2009. The antecedents and consequences of brand image: Based on Keller’s customer-based brand equity. D.Phil., Ohio State University. [online] Available at: https://etd.ohiolink.edu/apexprod/rws_etd/send_file/send?accession=osu1259560834 [Accessed on 4 October 2022].
- Parliamentary Monitoring Group. 2022. Recent student protests: UKZN, SAUT, USAf & SAUS input. Meeting summary. [online] Available at: https://pmg.org.za/committee-meeting/34467/ [Accessed on 2 October 2022].
- Patton M.Q. 2001. Qualitative Evaluation and research methods. 3rd edition. Thousand Oaks, CA: Sage Publications.
- Pitso, A.R.M. 2018. Assessing the effects of inadequate human capital affecting brand image of the hospitality and tourism industry. Masters in Management Sciences: Hospitality and Tourism, Durban University of Technology. https://doi.org/10.51415/10321/3294
- Posastiuc, C. 2013. The use of network metrics in building intelligence early warning systems: The Structural Conduciveness Index. International Review of Social Research, 3(3), pp. 63-70. doi: 10.1515/irsr-2013-0022
- Postma, D. 2016. An educational response to student Protest learning from Hannah Arendt. Education as Change, 20(1), pp. 1-5. doi: http://dx.doi.org/10.17159/1947-9417/2016/1042
- Ratner, B. 2009. The correlation coefficient: Its values range between +1/−1, or do they? Journal of Targeting, Measurement and Analysis for Marketing, 17, pp. 139–142. https://doi.org/10.1057/jt.2009.5
- Richards, B. 2016. Politics, Protest, emotion interdisciplinary, perspectives, Psychology of Protest. Bournemouth University. [online] Available at: https://pauljreilly.pressbooks.com/chapter/the-psychology-of-protest/ (1 March 2019).
- Richins, M.L. 1983. Negative word of mouth by dissatisfied consumers: A pilot study. Journal of Marketing, 47(1), pp. 68-78. https://doi.org/10.2307/3203428
- Schmidt, H.J., Mason, R.B., Steenkamp, P. and Mugobo, V. 2017. Does brand orientation contribute to retailers’ success? An empirical study in the South African market. Journal of Retailing & Consumer Services, 38, pp. 210-222. doi: https://doi.org/10.1016/j.jretconser.2017.06.012
- Schreiber, B. and Yu, D. 2016. Exploring student engagement practice at a South African University: Student engagement as a reliable prediction of academic performance. Journal of Higher Education, 3(5), pp. 157-175. doi: https://doi.org/10.20853/30-5-593
- Sekaran, U. and Bougie, R. 2016. Research methods for business: A skill building approach. 7th ed. New York: Wiley.
- Shrestha, N. 2021. Factor analysis as a tool for survey analysis. American Journal of Applied Mathematics and Statistics, 9(1), pp. 4-11. https://doi.org/10.12691/ajams-9-1-2
- Sultan, P. and Wong, H.Y. 2019. How service quality affects university brand performance, university brand image and behavioural intention: The mediating effects of satisfaction, trust and moderating roles of gender and study mode. Journal of Brand Management, 26(3), pp. 332 -347. doi: https://doi.org/10.1057/s41262-018-0131-3
- Taber, K.S. 2018. The use of Cronbach’s alpha when developing and reporting research instruments in science education. Research in Science Education, 48(6), pp. 1273-1296. doi: https://doi.org/10.1007/s11165-016-9602-2
- Taylor., S.A. Celuch, K. and Goodwin, S. 2004. The importance of brand equity to customer loyalty. Journal of Product & Brand Management, 13(4), pp. 217-227. doi: 10.1108/10610420410546934
- Tauyatswala, L. 2014. The anatomy of community protests in a post-apartheid South Africa. Umsebenzi Online, 13(7). [online] Available at: https://groups.google.com/g/umsebenzi-online/c/a6HB573qHI8 [Accessed on 15 December 2021].
- Temple, P. 2011. University branding: what can it do?. Perspectives: Policy and Practice in Higher Education, 15(4), pp. 113-116. doi: https://doi.org/10.1080/13603108.2011.602437
- Thwala, H. 2022. DUT shuts down three Durban campuses after violent protest. IOL Education, 15 February. [online] Available at: https://www.iol.co.za/news/education/universities/dut-shuts-down-three-durban-campuses-after-violent-protest-a66454a5-5c1a-45b9-9e45-3b5ffd51e44e [Accessed on 2 October 2023].
- Vukasovic, T. 2015. Managing Consumer based brand equity in higher education. Managing Global Transitions, 13(1), pp. 75-90.
Article Rights and License
© 2023 The Authors. Published by Sprint Investify. ISSN 2359-7712. This article is licensed under a Creative Commons Attribution 4.0 International License.