Keywordscustomer satisfaction generational cohort South Africa sports footwear
JEL Classification M30, M31
Full Article
1. Introduction
The South African population is dominated by youth. This youth market is referred to as Generation Y like any other country. Market (2004) defines Generation Y as people born between the period of 1985 and 2005. This definition implies that Generation Y consumers are people aged between 17 and 37 years in 2022. Generation Y consists of 42% of the South African population (Statistics South Africa, 2021). The majority of these Generation Y individuals are university students pursuing tertiary qualifications from different universities, which may suggest that they will have the potential to earn more and consume more in the future.
Bevan-Dye (2012) highlighted that the Generation Y cohort is an important segment for marketers as linked with higher earning potential after completing tertiary qualifications. In other words, Generation Y individuals who are in the position of obtaining a tertiary qualification have the potential for spending. Correspondingly, Generation Y consumers are generally known as big spenders who are highly selfish, spontaneous and very brand conscious (Lai and Teo, 2019). Sport footwear manufacturers must keep their brands aligned with Generation Y fashion trends in the market. According to Selvarajah (2018), Generation Y consumers have the ability to buy fashionable products. Sports footwear such as Reebok, Puma, Nike, Umbro, Fila and Adidas have become fashionable among Generation Y consumers (Lodjo and Tumwu, 2015; Ronaldo and Atik, 2015). There are expectations from these brands linked to customer satisfaction.
Customer satisfaction is regarded as one of the most important aspects any business aims to achieve.Customer satisfaction results from exceeding buyers’ expectations (Lodjo and Tumwu, 2015). Customer satisfaction is defined as customers’ feelings or attitudes based on the experience of using a product (Gilaninia et al., 2013). In other words, satisfaction determines how happy the customer is after using a product. According to Lodjo and Tumwu (2015), the customer is satisfied if the performance meets expectations. In addition, if product performance exceeds expectations, the customer is extremely satisfied with the product (Lodjo and Tumwu, 2015). Sport footwear manufacturers always strive for customer satisfaction. A strong base of satisfied customers allows the business to increase its market shares, maintain its leadership and grow (Taqi and Muhammad, 2020; Puska et al., 2018). Furthermore, consumer satisfaction is a critical marketing tool that has the ability to help a business and results in winning and gaining more competitive advantages that create long-term relationships with customers and help the business for long-term success (Azizan and Yurs, 2019). This study is investigating factors contributing to poor footwear satisfaction levels among Gen Y university students. Factors with wide coverage in literature such as brand image, perceived quality, brand associations, style, comfort, colour, brand name, price and endorsement are examined as factors influencing customer satisfaction towards sports footwear brands. In the ensuing section, the focus is on the review of literature on these factors.
2. Literature Review
2.1 Brand Image
Keller (1993) formally defined brand image as perception about a brand as reflected by brand association held in consumer memory. Azizan and Yurs (2019) highlighted that customers generate a brand image as a result of a product’s appearance, characteristics and how the product markets its functions to consumers. It is essential for marketers of sports footwear brands to establish a unique and strong brand image to make their brand successful in the market. Cuong (2020) highlighted that brand image plays a vital role in the decision-making process to purchase among consumers, which leads to the business’ generation of profit (Tu et al., 2013). According to Taqi and Muhammad (2020), consumers can differentiate the brand from competing brands, which enables them to purchase brands aligned with their needs and wants through brand image. If a brand image can strive to align its brand to the needs and wants of consumers, this will lead to customer satisfaction. Indeed, some studies (Cuong, 2020; Taqi and Muhammad, 2020) have investigated the influence of brand image on customer satisfaction. Both studies confirmed that brand image does have a positive influence on customer satisfaction. In line with the above literature, this study aims to investigate the impact of brand image on customer satisfaction with sports footwear brands among the Generation Y cohort.
2.2 Perceived Quality
Perceived quality is defined as the overall quality or superiority of a product or service in comparison to substitutes (Keller, 2007). In other words, perceived quality is basically overall perceptions about the quality of the product by consumers (Kassim et al., 2013). This perception appears to be based on a comparison between competing products in the marketplace (Zzudin and NovandariI, 2018). According to Aaker (1991), consumers compare the quality of the product based on its performance, features, reliability and durability. For example, a consumer may be satisfied with Adidas because of the performance of the brand or satisfied with Nike because of its durability. As such, manufacturers of sports footwear brands need to focus on quality during the manufacturing stage to gain positive responses from customers. A brand with strong perceived quality will be able to introduce extensions and will be more successful in terms of probability than a brand with weak perceived quality (Kandasamy, 2014). Suttikun and Meeprom (2021) stated that the more customers perceive the product as a quality product, the more they are satisfied with the product. The literature presented several studies (Zzudin and NovandariI, 2018; Othman et al., 2017; Hanifati and Salehudin, 2021;Kurnianingsih and Riorini, 2021;Samudro et al., 2020) examining the influence of perceived quality on customer satisfaction. The results indicated that perceived quality positively influences customer satisfaction. In line with the above literature suggestion, this study aims to investigate the impact of brands’ perceived quality on customer satisfaction with sports footwear brands among the Generation Y cohort.
2.3 Brand Associations
Brand associations refer to the meaning of the brand to consumers (Falahat et al., 2018).The brand association also refers to everything related to the brand in consumers’ minds (Bae, 2020). The meaning of the brand can be anything that consumers can memorise and link to the brand (Chen and Qin, 2021). Brand associations are classified into three categories, namely attributes, benefits and attitude. Attributes include “non-product-related attributes” and “product-related attributes” such as price information, packaging, user imagery or usage imagery (Phong et al., 2020). For example, a brand such as Jordan by Nike is priced higher and might suggest luxury and quality among consumers. Likewise, the higher price will signal the message that the product is of higher quality and lead the consumer to form a positive brand association with the product (Chen et al., 2013). Benefits are personal values consumers can attach to the product (Keller, 1993). These benefits are functional advantages and user experience (Doddy et al., 2020). Attitude is based on consumer behaviour in terms of brand choice by evaluating brand strength and favourability (Ali, 2020). In other words, attitude is consumers’ evaluation of a product, which can be positive or negative. Brand associations play an important role in differentiating one organisation from others, and creating favourable attitudes towards an organisational product, which is drastically beneficial to an organisation (Phong et al., 2020). The higher the brand associations in the product are, the more it will be remembered by the consumer (Phong et al., 2020). Therefore, this suggests satisfaction from the consumers. Indeed, studies conducted by various scholars (Susanti et al., 2020;Sedky et al., 2020) proved that brand association results in customer satisfaction with the brand. In line with the above literature, this study aims to investigate the impact of brand association on customer satisfaction with sports footwear brands among the Generation Y cohort.
2.4 Product Style
Product style can be defined as the features and characteristics of a product that have abilities to satisfy customer needs (Lodjo and Tumewu, 2015). Brands that offer stylish footwear attract consumers who are fashion conscious (Yee and Sidek, 2008). According to Lodjo and Tumewu (2015), footwear brand manufacturers follow styles and make them easy to be remembered by customers. The style of sports footwear can make consumers confident when wearing it (Lodjo and Tumewu, 2015). Nowadays, consumers have a tendency to match their clothing to various occasions, thereby suggesting that the footwear industry should improve its product styles (Ruixia and Chein, 2019). A product style that appeals greatly to a consumer will create a relational affiliation between the consumer and the brand because a product style reflects the brand’s personality (Ruixia and Chein, 2019). For example, a brand such as Nike is perceived as trendy, sincere and exciting (Su and Tong, 2015). Such a brand has the potential to attract consumers who view self-image as trendy. In contrast, Adidas is perceived as friendly, charming and intelligent (Chandel and Tewari, 2015). Therefore, Adidas can only attract consumers viewing their self-image as friendly, charming and intelligent. Bat-ochir (2018) emphasised that making a variety of styles for a product is the best way to get customers satisfied. Correspondingly, consumers gain more satisfaction from wearing the latest style of the product (Yee and Sidek, 2008). The study by Lodjo and Tumewu (2015) identified product style as a determinant of satisfaction among customers. In line with the above argument, this study aims to investigate the impact of product style on customer satisfaction with sports footwear brands among the Generation Y cohort.
2.5 Comfort
Comfort refers to the consumer’s feelings when using a product. Ahmed-Kristensen and Stavrakos (2012) highlighted that comfort is an important issue in the design of many consumer products, especially those with physical contact with the consumer such as sports footwear products. There is no doubt that manufacturers of sports footwear brands are expected to prioritise comfort in their products during the manufacturing stages. Consumers prefer sports footwear that is comfortable (Mehra, 2017). Comfort makes consumers believe that a product will meet their expectation and purchase it (Al-Msallam, 2015). Furthermore, comfort presents happiness among consumers and they feel like there is added value obtained resulting in strong relations with the brand (Fathorrahman et al., 2020). If businesses wish to create satisfaction for customers, they need to focus on comfort (Khuong and Dai, 2016). Therefore, a comfortable product leads to customer satisfaction (Christeena et al., 2019). Some studies (Zulkiffli et al., 2022; Balachandran and Hamzah, 2017; Horsu and Yeboah, 2015) have investigated the influence of comfort on customer satisfaction and the results of the studies confirmed that indeed comfort does influence customer satisfaction. In line with the above literature evidence, this study aims to investigate the impact of comfort on customer satisfaction with sports footwear brands among the Generation Y cohort.
2.6 Colour
Colour is the visual presentation/s surrounding a product all around. For example, a Jordan sneaker can be black all around and include a logo in white colour. Marketers use different colours to increase brand recognition among consumers (Kumar, 2017). Using a specific colour can send a positive or negative message about the product, as it has a different meaning from culture or religion (Bytyçi, 2020); for example, the colour white means happiness to some cultures and bad luck to others. Because of such connotations, marketers need to be very careful when choosing the colour of their products. The first thing to consider is the culture of the market to be served with the product. Mehra (2017) highlighted that consumers pay attention to colour when purchasing footwear and prefer something colourful. Manufacturers of sports footwear can satisfy consumers by offering colourful sneakers. In line with the above literature, this study aims to investigate the impact of colour on customer satisfaction with sports footwear brands among the Generation Y cohort.
2.7 Brand Name
A brand name refers to something that can be vocalised by consumers (Cunningham, 2018). In other words, a brand name can be a meaning of something that can be written in full or abbreviated. For example, the brand name of sports footwear Adidas comes from the founder of the brand Adolf “Adi” Dassler (Stromsodd, 2020). The brand name is important for a product in order to be successful, as customers buy according to the brand name (Yeap et al., 2018). Correspondingly, the consumer prefers to buy trusted and bigger brand names that are more powerful (Ronaldo et al., 2015). Anita (2014) highlighted that consumers who are satisfied with a brand name are willing to purchase the very same brand even if the price increases or is higher compared to competitive brands. In line with the above literature, this study aims to investigate the impact of brand name on customer satisfaction with sports footwear brands among the Generation Y cohort.
2.8. Price
Prices reflect the value that consumers exchange for the benefits of having or using products and services, and they also embody what needs to be given up or sacrificed to obtain a product (Falahat et al., 2018). Price is defined as the monetary value paid by consumers to get the product (Iqbal et al., 2013). In this study, price is what consumers pay for the ownership of sports footwear brand ‘sneakers’. For example, a customer can pay an amount of R2 000 for Air Force by Nike. According to Kinuthia (2012), price can be compared with perceived costs and value to build customer satisfaction. Marketers of sports footwear brands should consider the value that consumer gets when buying a sneaker. Such an approach will increase customer satisfaction among customers. According to various studies (Javed et al., 2021; Yulisetiarini and Prahasta, 2019), the price of a product does influence customer satisfaction. In line with the above narrative, this study aims to investigate the impact of price on customer satisfaction with sports footwear brands among the Generation Y cohort.
2.9. Celebrity Endorsement
Celebrities are individuals who enjoy public recognition and mostly they are the experts in their respective disciplines, having wider influence in public life and the societal domain (Prasad, 2013). They can be in a form of artists, athletes and experts. Most of these celebrities are seen endorsing brands. According to Prasad (2013), celebrity endorsements offer a brand a touch of glamour, and the hope that a prominent face will provide added charm and name recognition in a crowded market. For example, the world soccer star Cristiano Ronaldo endorses Nike (Pereira, 2021). In recent years, businesses and marketers have used celebrities to promote their products (Calvo-Porral, 2021). With the increasing development of the internet and social media, celebrity endorsement is becoming an increasingly important medium for communicating with consumers. It is important for marketers to select an appropriate celebrity to endorse their products. A celebrity endorser is somebody who is believed to have the ability to represent a product (Supriyadi et al., 2020). This will encourage customer satisfaction with the celebrity endorsing the brand. Studies conducted by Domfeh et al. (2018) as well as Rehman et al. (2019) found that celebrity endorsement does influence customer satisfaction. In line with these narratives, this study aims to investigate the impact of celebrity endorsement on customer satisfaction with sports footwear brands among the Generation Y cohort.
The conceptual framework adopted in this study is depicted in Figure 1.
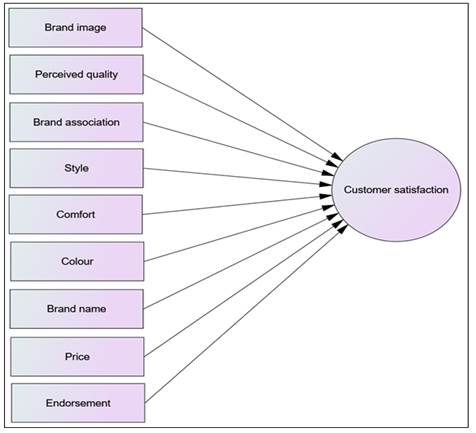
Figure 1: Proposed research model
3. Research Design and Methodology
A descriptive research design and a single cross-sectional survey with a quantitative method were implemented in this study.
3.1. Data Collection Procedure
To achieve its goals, the study used a descriptive research design and a quantitative research approach. The required data for the study’s aims was collected via a self-administered questionnaire. Section A and Section B were the two sections of the questionnaire. The participants’ demographic information was given in Section A. In Section B, questions were asked on the factors that influence customer satisfaction levels of sports footwear brands. The questionnaire’s measurement scale had nine constructs (brand image, perceived quality, brand association, style, comfort, colour, brand name, price and endorsement). Participants scored each construct on a seven-point Likert scale, with 1 indicating severe disagreement and 7 indicating strong agreement.
3.2. Sampling Method
The study used convenience and non-probability sampling methods. The study had a total of 387 participants, which is sufficient for the type of analysis undertaken in this study to meet its goals. The study’s participants were Generation Y students enrolled in a traditional university and a university of technology in South Africa’s Free State Province. They were between the ages of 18 and 25. Four of the 387 people who took part in the study did not specify their gender. The gender distribution was about equal, with slightly more males (N=193; 50.04 per cent) than females (N=190; 49.06 per cent) (see Table 1).
4. Results and Analysis
4.1 Descriptive Statistics and Reliability of Scales
In terms of the gender composition of the research participants, there was fair representation; there were slightly more males (50.4%, N = 193) than females (49.6%, N = 190) who took part. The mean values of all nine constructs were greater than 3.5, indicating that the factors are important in predicting sports footwear brands in general. Nike, Adidas, Puma, Kapppa and Asics are the top five sports footwear brands among Generation Y university students. For each construct, Cronbach alphas were computed. The values of Cronbach alphas were all above 0.6 (Malhotra, 2010) and varied from 0.62 to 0.80, indicating that the scales employed in the study were internally consistent.
Table 1: Descriptive statistics and reliability of scales
| Reliability | Number of items | Cronbach’s alpha | Mean | Std. dev. | Favourite brands | Frequency (%) |
| Brand image | 4 | 0.79 | 4.93 | 1.38 | Nike | 238 (61.5%) |
| Brand association | 5 | 0.80 | 5.75 | 1.03 | Adidas | 211 (54.5%) |
| Perceived quality | 4 | 0.80 | 6.10 | 0.84 | Puma | 58 (15.2%) |
| Style | 3 | 0.76 | 5.96 | 0.90 | Kappa | 23 (5.9%) |
| Comfort | 2 | 0.65 | 6.35 | 0.88 | Asics | 12 (3.1%) |
| Colour | 3 | 0.66 | 5.77 | 1.10 | Umbro | 5 (1.3) |
| Brand name | 3 | 0.63 | 5.28 | 1.15 | Other | 34 (8.8%) |
| Price | 3 | 0.62 | 5.26 | 1.20 | Gender | |
| Endorsement | 2 | 0.72 | 4.16 | 1.69 | Male | 193 (50.4%) |
| Satisfaction | 3 | 0.78 | 5.67 | 1.07 | Female | 190 (49.6%) |
4.2 Correlation Analysis
As indicated in the correlation matrix table (Table 2), a positive association between each pair of the variables investigated in this study is detected. These statistics provide support for the nomological validity of the measurement theory as suggested by Hair et al. (2010) and Malhotra (2010). In addition, none of the coefficients were above the 0.90 threshold, and this implies that there was no multicollinearity concern between the constructs under investigation.
Table 2: Correlation matrix
| Constructs | 1 | 2 | 3 | 4 | 5 | 6 | 7 | 8 | 9 | 10 |
| Brand image (1) | 1 | .633** | .428** | .418** | .382** | .385** | .572** | .216** | .314** | .427** |
| Brand association (2) | 1 | .597** | .548** | .466** | .508** | .515** | .251** | .259** | .514** | |
| Perceived quality (3) | 1 | .588** | .537** | .375** | .427** | .214** | .124* | .500** | ||
| Style (4) | 1 | .465** | .420** | .415** | .233** | .192** | .478** | |||
| Comfort (5) | 1 | .465** | .331** | .171** | 0.022 | .475** | ||||
| Colour (6) | 1 | .523** | .161** | .216** | .419** | |||||
| Brand name (7) | 1 | .227** | .332** | .537** | ||||||
| Price (8) | 1 | .179** | .271** | |||||||
| Endorsement (9) | 1 | .238** | ||||||||
| Satisfaction (10) | 1 | |||||||||
| **. Correlation is significant at the 0.01 level (2-tailed). | ||||||||||
| *. Correlation is significant at the 0.05 level (2-tailed). | ||||||||||
4.3 Regression Analysis
Table 4 shows the results of the multivariate regression analysis and collinearity statistics. Table 4 shows that there was no collinearity problem because the tolerance values were above the cut-off level of 0.10 and the variance inflation factor of the variables was less than the cut-off level of 10.00. (Pallant, 2010). After determining that there was no issue with collinearity, a multivariate regression analysis was used to identify and analyse the factors that influence sports footwear satisfaction in South Africa.
As independent variables, nine predictors (factors) were included, namely endorsement, comfort, price, brand name, style, colour, brand image, perceived quality and brand association, with customer satisfaction as the dependent variable. The F-ratio (42.178) was significant at p < 0.01, indicating the model’s applicability in predicting Generation Y brand customer satisfaction levels of sports footwear, as shown in Table 3. As illustrated by the R2 value, the six independent factors that had a statistically significant influence explain about 45% of the variance in Generation Y consumers’ satisfaction levels with sports footwear brands.
Table 3: Regression model summary: ANOVA results
| Model | R | R-square | Adjusted R-square | Std. error of the estimate | F | Sig. |
| 1 | .671a | .450 | .437 | .803893009928410 | 34.325 | 0.000 |
| a. Predictors: (Constant), Endorsement, Comfort, Price, B.Name, Style, Colour, B.Image, Perce.Quality, B.Assoc | ||||||
As reflected in Table 4, six of the nine factors, namely brand association, perceived quality, style, comfort, brand name and price, have produced t-statistics that indicate a significant statistical influence on customer satisfaction levels of sports footwear brands. These findings do provide support for previously conducted empirical studies. For example, perceived quality was investigated by various studies and was found to have a positive influence on customer satisfaction (Zzudin and Novandari, 2018; Othman et al., 2017; Hanifati and Salehudin, 2021; Kurnianingsih and Riorini, 2021; Samudro et al., 2020). Similarly, Susanti et al. (2020) and Sedky et al. (2020) investigated the influence of brand association on customer satisfaction and it was found to positively influence customer satisfaction. The influence of style on customer satisfaction was investigated and a positive impact was observed (Lodjo and Tumewu, 2015). Several other studies (Zulkiffli et al., 2022; Balachandran and Hamzah, 2017; Horsu and Yeboah, 2015) confirm the positive influence of comfort on customer satisfaction. Anita (2014) studied the influence of brand name on customer satisfaction and found that brand name does positively influence customer satisfaction. Finally, the price was investigated by various studies (Javed et al., 2021; Yulisetiarini and Prahasta, 2019), and its positive influence on customer satisfaction is confirmed.
As reported in Table 4, however, three of the nine factors, namely brand image, colour and endorsement, did not produce statistically significant t-statistics and therefore cannot be considered as factors that influence customer satisfaction levels of sports footwear brands based on the results of the current study. The results of this study in respect of these three variables do not support previous studies presented in the literature, which may need further investigation with a bigger population size that may include all age cohorts. Two studies (Cuong, 2020; Taqi and Muhammad, 2020) found in the literature investigated brand image influencing customer satisfaction, and brand image was found to positively influence customer satisfaction in both studies. Colour was recommended in the study conducted by Mehra (2017) and emphasised the impact it has on customer satisfaction. The endorsement was investigated by Domfeh et al. (2018) and Rehman et al. (2019) towards customer satisfaction and was found to exert a positive influence on customer satisfaction.
Table 4: Beta coefficients of factors that influence sports footwear brands
|
Model |
Unstandardised coefficients |
Standardised coefficients |
t |
Sig. |
Collinearity statistics |
|||
|
B |
Std. error |
Beta |
Tolerance |
VIF |
||||
|
1 |
(Constant) |
-.184 |
.373 |
-.492 |
.623 |
|||
|
B.Image |
-.019 |
.042 |
-.024 | -.447 | .655 | .499 | 2.002 | |
| B.Assoc | .122 | .062 | .117 | 1.970 | .050 | .412 | 2.426 | |
| Perce.Quality | .152 | .069 | .119 | 2.187 | .029 | .491 | 2.037 | |
| Style | .126 | .061 | .106 | 2.071 | .039 | .558 | 1.792 | |
| Comfort | .245 | .060 | .201 | 4.053 | .000 | .591 | 1.693 | |
| Colour | .010 | .048 | .011 | .213 | .832 | .586 | 1.707 | |
| B.Name | .264 | .049 | .283 | 5.380 | .000 | .528 | 1.895 | |
| Price | .076 | .036 | .085 | 2.118 | .035 | .904 | 1.107 | |
| Endorsement | .041 | .027 | .065 | 1.536 | .125 | .825 | 1.211 | |
| a. Dependent Variable: Satisfaction | ||||||||
5. Conclusion and Recommendations
Sports footwear is a significant business and Generation Y consumers are regarded as a profitable consumer segment for this product category. The purpose of this study was to determine what factors influence customer satisfaction in the case of sports footwear brands in South Africa. Following a quantitative research method, the study has found that six of the nine independent variables, namely brand association, perceived quality, style, comfort, brand name, and price, as determinants of Generation Y consumers’ satisfaction levels with sports footwear brands, while three of the nine variables, namely brand image, colour, and endorsement, had an insignificant impact on the same age cohort’s satisfaction levels.
Generation Y customers are more interested in a specific brand name among sporting brands. Likewise, this study was dominated by six sports brand names, i.e. Nike, Adidas, Puma, Kappa, Asics and Umbro. Marketers of the sports footwear brands that were not identified as favourite brands in the study are advised to evaluate their marketing strategies and manufacturing processes. In doing so, the brands may improve brand awareness among Generation Y customers. Those sports brands identified as favoured brands by Generation Y customers are also encouraged to evaluate factors that were found insignificant in influencing customer satisfaction among Generation Y cohorts. Improvement of those factors may strengthen these brands and their competitive advantage in the market. This study presents limitations like any other research study. The participants of this study were Generation Y university students from Gauteng and the Free State Provinces in South Africa. This may not be a true reflection of the South African population. Future studies may need to expand to other provinces and include other age cohorts. In addition, the study employed quantitative research methods only; future studies may need to consider qualitative research to explore more on the subject of customer satisfaction of sports footwear products.
---
Author Contributions: Nkosinamandla Erasmus Shezi and Ephrem Habtemichael Redda: Conceptualization, Methodology, Software, Validation, Formal analysis, Investigation, Resources, Data Curation, Writing - Original Draft, Writing - Review and Editing, Visualization.
Acknowledgements: The authors acknowledge all the supports received from participants and colleagues.
Funding:There was no external funding received for this research.
Conflicts of Interest: None.
References
- Aaker, D. A., 199. Managing brand equity: capitalizing on the value of brand name. The Free Press.
- Ali, M.A.B., 2020. Factors Affecting Customers Loyalty to Mobile Services Companies’ Brands. International Journal of Marketing Studies, 12(2), pp.1-85. https://doi.org/10.5539/ijms.v12n2p85
- Ahmed-Kristensen, S. and Stavrakos, S. K., 2012. Definition of comfort in design and key aspects-A literature review. In NordDesign 2012. Aalborg University, Center for Industrial Production.
- Al-Msallam, S., 2015. Customer satisfaction and brand loyalty in the hotel industry. International Journal of Management Sciences and Business Research, 4.
- Anitha, L., 2014. Brand Loyalty and Brand Preferences of Women in the Choice of Footwear in Coimbatore City, Tamil Nadu. International Journal of Engineering and Management Research, 4(2), pp.1-11.
- Azizan, N.S. and Yusr, M.M., 2019. The influence of customer satisfaction, brand trust, and brand image towards customer loyalty. International Journal of Entrepreneurship, 2(7), pp.93-108. https://doi.org/10.35631/ijemp.270010
- Bae, S., Jung, T.H., Moorhouse, N., Suh, M. and Kwon, O., 2020. The influence of mixed reality on satisfaction and brand loyalty in cultural heritage attractions: A brand equity perspective. Sustainability, 12(7), p.2956. https://doi.org/10.3390/su12072956
- Balachandran, I. and Hamzah, I.B., 2017. The influence of customer satisfaction on ride-sharing services in Malaysia. International Journal of Accounting and Business Management, 5(2), pp.184-196.
- Bat-Ochir,T., Bold, B., Sodnom-Ochir,M., Sodnom-Ochir,J and Munkhbat, U. 2018. International Journal of Management and Applied Science, 4(2), pp.29-34
- Bevan-Dye, A. L. 2013. Black Generation Y students’ attitudes towards Web advertising value. Mediterranean Journal of Social Sciences, 4(2), pp.155-164. https://doi.org/10.5901/mjss.2013.v4n2p155
- Bytyçi, S., 2020. Influence of colors as a key element in consumer marketing. 778946770.
- Calvo-Porral, C., Rivaroli, S. and Orosa-González, J., 2021. The Influence of Celebrity Endorsement on Food Consumption Behavior. Foods, 10(9), p.2224. https://doi.org/10.3390/foods10092224
- Chandel, A. and Tewari, S.C. 2015. Brand personality of Adidas and its antecedents. Sai Om Journal of Commerce and Management, 9(2), pp.13-19.
- Chen, T.Y., Yeh, T.L. and Jheng, W.S., 2013. Factors influencing brand association. African Journal of Business Management, 7(19), pp.1914-1926. https://doi.org/10.2991/assehr.k.211209.524
- Chen, Y. and Qin, H., 2021, December. The Relationship Research Between Brand Association, Brand Awareness, Brand Satisfaction, and Brand Loyalty in Three Squirrels’ Virtual Image. In 2021 3rd International Conference on Economic Management and Cultural Industry (ICEMCI 2021) (pp. 3215-3221). Atlantis Press.
- Crampton, S. M. and Hodge, J. W. 2009. Generation Y: unchartered territory. Journal of Business and Economics Research, 7(4), pp.1-6. https://doi.org/10.19030/jber.v7i4.2272
- Cunningham. N. 2018. Introduction to marketing: A South African Perspective. 1st ed. Pretoria: Van Schaik
- Cuong, D.T., 2020. The impact of customer satisfaction, brand image on brand love and brand loyalty. Journal of Advanced Research and Control Systems, 12, pp.3151-3159. https://doi.org/10.5373/JARDCS/V12SP3/20201308
- Cuong, D.T., 2020. The impact of customer satisfaction, brand image on brand love and brand loyalty. Journal of Advanced Research and Control Systems, 12, pp.3151-3159. https://doi.org/10.5373/JARDCS/V12SP3/20201308
- Doddy, M., Ali, J., Hindardjo, A. and Ratnasih, C., 2020. The Influence of Brand Awareness, Perceived Quality, Brand Association, Brand Loyalty on Brand Equity of Zakat Institutions. https://doi.org/10.4108/eai.26-9-2020.2302683
- Domfeh, H.A., Kusi, L.Y., Nyarku, K.M. and Ofori, H., 2018. The mediating effect of customer satisfaction in the predictive relation between celebrity advertising and purchase intentions in telecom industry in Ghana: University Students’ Perspective. International Journal of Business and Management Invention (IJBMI), 7(3), pp.40-54.
- Equity(4th edition). Essex: Pearson Education Limited.
- Fathorrahman, T., Puspaningrum, A. and Suyono, J. 2020. Brand Satisfaction, Brand Trust and Brand Loyalty. Proceedings of the 2nd African International Conference on Industrial Engineering and Operations Management Harare, Zimbabwe. 2708-2718.
- Hanifati, L. and Salehudin, I., 2021. The Effect of Perceived Product Quality, Brand Personality, and Loyalty on Brand Switching Intention of Technological Products. The South East Asian Journal of Management, 15(2), pp.169-187. https://doi.org/10.21002/seam.v15i2.13336
- Horsu, E.N. and Yeboah, S.T., 2015. Influence of service quality on customer satisfaction: A study of minicab taxi services in Cape Coast, Ghana. International Journal of Economics, Commerce and Management, 3(5), pp.1451-1464.
- Irfan, T. and Siddiqui, M., 2021. Investigating the Contributors to Brand Loyalty with a Mediating Role of Satisfaction: Evidence from Pakistan. Journal of Marketing Strategies, 3(2), pp.70-86. https://doi.org/10.52633/jms.v3i2.72
- Izzudin, M.S. and Novandari, W., 2018. The Effect Of Perceived Quality, Brand Image On Customer Satisfaction And Brand Awareness Toward Repurchase Intention. Journal of Research in Management, 1(3). https://doi.org/10.32424/jorim.v1i3.44
- Javed, S., Rashidin, M.S. and Jian, W., 2021; Khan and Hameed, 2017). Predictors and outcome of customer satisfaction: moderating effect of social trust and corporate social responsibility. Future Business Journal, 7(1), pp.1-18.
- Kandasamy, C., 2014. Impact of customer brand perceived quality on buying intention of durable products-A customer’s view. International Journal of Management and Social Science Research Review, 1(3), pp.1-5.
- Kassim, A.W.M., Igau, O.A., Swidi, A.K., Tahajuddin, S.B. and Neezm, S.M.A., 2013. The role of perceived product quality and customer satisfaction on brand loyalty among mobile phone users. In Proceedings of the 6th International Conference of the Asian Academy of Applied Business (pp. 1-15).
- Keller, K.L., 2013. Strategic Brand Management. Building, Measuring, and Managing Brand. London: Pearson.
- Keller, K.L., 1993. Conceptualizing, measuring, and managing customer-based brand equity. Journal of marketing, 57(1), pp.1-22. https://doi.org/10.1177/002224299305700101
- Khuong, M.N. and Dai, N.Q., 2016. The Factors Affecting Customer Satisfaction and Customer Loyalty--A Study of Local Taxi Companies in Ho Chi Minh City, Vietnam. International Journal of Innovation, Management and Technology, 7(5), p.228. https://doi.org/10.18178/ijimt.2016.7.5.678
- Kumar, J.S., 2017. The psychology of colour influences consumers’ buying behaviour–a diagnostic study. Ushus Journal of Business Management, 16(4), pp.1-13. https://doi.org/10.12725/ujbm.41.1
- Kurnianingsih, S.W. and Riorini, S.V., 2021. The Influence of Consumer-Based Brand Equity on Brand Loyalty Through Customer Satisfaction. Indonesian Journal of Business Analytics, 1(2), pp.141-160. https://doi.org/10.54259/ijba.v1i2.67
- Lai, R. and Teo, S.C., 2019. Analysing the moderating effects of generational cohorts on brand loyalty in the Malaysian footwear industry. Jurnal Pengurusan, 56, pp.1-18. https://doi.org/10.17576/pengurusan-2019-56-07
- Lodjo, R.A. and Tumewu, F., 2015. INFLUENCE OF BRAND LOYALTY ON CONSUMER SATISFACTION TOWARDS SPORTSWEAR (FUTSAL SHOES). Jurnal EMBA: Jurnal Riset Ekonomi, Manajemen, Bisnis dan Akuntansi, 3(3), pp.241-251. https://doi.org/10.21831/jk.v3i2.6262
- Markert, J., 2004. Demographics of age: generational and cohort confusion. Journal of Current Issues and Research in Advertising, 26(2), pp.11-25. https://doi.org/10.1080/10641734.2004.10505161
- Othman, M., Kamarohim, N. and Nizam, F.M., 2017. Brand Credibility, Perceived Quality and Perceived Value: A Study of Customer Satisfaction. International Journal of Economics and Management, 11.
- Pereira, P., 2021. Top 5 Nike Athlete Endorsements. [online] Available at: https://financefootball.com/2021/01/09/top-5-nike-athlete-endorsements/ [Accessed on 22 Mar. 2022].
- Prasad, C.J., 2013. Brand endorsement by celebrities impacts towards customer satisfaction. African journal of business management, 7(35), pp.3630-3635. https://doi.org/10.5897/AJBM11.2571
- Puška, A., Stojanović, I. and Berbić, S., 2018. The impact of chocolate brand image, satisfaction, and value on brand loyalty. Economy and Market Communication Review/Casopis za Ekonomiju i Trzisne Komunikacije, 8(1).
- Rehman, S.U., Bano, T. and Bhatti, A., 2019. Factors influencing online purchase intention with the mediating role of customer satisfaction. International Journal of Economics, Management and Accounting, 27(1), pp.235-252.
- Ronaldo, W. and Atik, A., 2015. Factors influencing brand loyalty towards sportswear in Bandung. Journal of business and management, 4(8).
- Sedky, M., Alika, V.A. and Aldiansyah, P., Effect of Customer-Based Brand Equity on Customer Satisfaction in Shopee Indonesia.
- Selvarajah, D.D., 2018. The factor influencing brand loyalty in fashion industry among generation Y in Malaysia. International Journal of Business and Management, 13(4), pp.201-209. https://doi.org/10.5539/ijbm.v13n4p201
- Statistics South Africa. 2021. Midyear Population estimates. [online] Available at: http://www.statssa.gov.za/publications/P0302/P03022021.pdf [Accessed on 10 Mar. 2022].
- Su, J. and Tong, X., 2015. Brand personality and brand equity: evidence from the sportswear industry. Journal of Product and Brand Management, 24(2), pp.124-133. https://doi.org/10.1108/JPBM-01-2014-0482
- Supriyadi, Y.L. and Prajogo, W., 2020. The relationship among celebrity endorser, self-brand connection, relationship quality and repurchase intention: The moderating role of customer satisfaction and media type. International Journal of Innovation, Creativity and Change, 12(5), pp.238-253.
- Susanti, V., Sumarwan, U., Simanjuntak, M. and Yusuf, E.Z., 2019. How to manage customer satisfaction through brand association and perceived value strategy. J. Mgt. Mkt. Review, 4(3), pp.184-193. https://doi.org/10.35609/jmmr.2019.4.3(3)
- Suttikun, C. and Meeprom, S., 2021. Examining the effect of perceived quality of authentic souvenir product, perceived value, and satisfaction on customer loyalty. Cogent Business and Management, 8(1), p.1976468. https://doi.org/10.1080/23311975.2021.1976468
- Taqi, I. and Muhammad, G., 2020. Brand loyalty and the mediating roles of brand image and customer satisfaction. Market Forces, 15(1).
- Tramsodd, J. 2020. What Does Adidas Stand For? Meaning and Pronunciation Explained. [online] Available at: https://www.yournextshoes.com/adidas-meaning/ [Accessed on 27 Mar. 2022].
- Tu, Y.T. and Chih, H.C., 2013. An empirical study of corporate brand image, customer perceived value and satisfaction on loyalty in shoe industry. Journal of Economics and Behavioral Studies, 5(7), pp.469-483. https://doi.org/10.22610/jebs.v5i7.421
- Yeap, J.A., Ramayah, T. and Yapp, E.H., 2018. Key drivers of brand loyalty among malaysian shoppers: evidence from a japanese fashion retailer. Asian Academy of Management Journal, 23(2). https://doi.org/10.21315/aamj2018.23.2.1
- Yee, A.F and Sidek, B., 2008. Influence of brand loyalty on consumer sportswear. International Journal of Economics and Management, 2(2), pp.221 – 236.
- Yen, Y.Y., Rasdi, W.F.W., Rasiah, D.A. and Ramasamy, S.A., 2018. Key Determinants of Smart Phone Brand Loyalty. The Journal of Social Sciences Research, pp.724-733. https://doi.org/10.32861/jssr.spi2.724.733
- Yulisetiarini, D. and Prahasta, Y.A., 2019. The effect of price, service quality, customer value, and brand image on customers satisfaction of telkomsel cellular operators in east Java Indonesia.
- Zulkiffli, W.F.W., Mahshar, M., Hashim, N.A.A.N., Anuar, N.I.M. and Muhammad, M.Z., 2020. Investigating The Effect of Service Quality on Customer Satisfaction Case Study: Ride-Hailing Service in Malaysia. International Journal of Engineering Research and Technology, pp. 5423-5428.
Article Rights and License
© 2022 The Authors. Published by Sprint Investify. ISSN 2359-7712. This article is licensed under a Creative Commons Attribution 4.0 International License.