Keywordscomparative analysis entrepreneurial ecosystems entrepreneurship FORTHEM Alliance GEM
JEL Classification L26
Full Article
1. Introduction
Entrepreneurship is widely regarded as a fundamental driver of economic development, innovation and competitiveness. Numerous studies affirm that entrepreneurial activity acts as a catalyst for technological diffusion, job creation and regional economic restructuring (Acs and Tarpley, 1998; Acs and Armington, 2006; Carree and Thurik, 2010). Within the European context, the capacity to foster sustainable entrepreneurial ecosystems is particularly relevant as the European Union continues to navigate post-crisis economic challenges, labor market transformations and uneven regional development trajectories (Baltador et al., 2024).
The period 2021–2024 constitutes a distinctive temporal window for examining entrepreneurship in Europe. It reflects the immediate post-pandemic recovery, the acceleration of digital transformation, inflationary pressures and significant structural shifts affecting both new and established firms. Scholars have noted that these short-term economic dynamics have intensified the need for comparative analyses of the resilience and adaptability of national entrepreneurial ecosystems (Dligach and Stavytskyy, 2024; Obrenovic et al., 2020).
This study is situated within the institutional framework of the FORTHEM Alliance (Fostering Outreach within European Regions, Transnational Higher Education and Mobility), a transnational network of universities spanning diverse socio-economic contexts across Europe. The FORTHEM Alliance brings together nine public universities across Europe to build an integrated, student-centered and inclusive European University strongly connected to their regional ecosystems. Representing over 232,000 students and 36,000 staff, the Alliance strengthens education, research, innovation and knowledge transfer by promoting multidisciplinary, multicultural and multilingual collaboration. The alliance includes Germany, France, Poland, Finland, Latvia, Spain, Italy, Norway and Romania. These countries represent a highly heterogeneous group, ranging from advanced innovation-driven economies to dynamic emerging entrepreneurial systems. Given the alliance’s strategic commitment to fostering innovation, and the strong emphasis placed on entrepreneurship within its programs and partnerships, there is substantial value in a systematic comparison of their entrepreneurial profiles. The FORTHEM Alliance’s educational, research and mobility initiatives can be strengthened only by a nuanced understanding of how entrepreneurial ecosystems function across its member regions (Forthem, 2023).
To achieve this, the study employs the Global Entrepreneurship Monitor (GEM), which provides internationally harmonized indicators derived from two core instruments: the Adult Population Survey (APS), which measures perceptions and activity, and the National Expert Survey (NES), which evaluates systemic entrepreneurial framework conditions. Previous research has demonstrated that NES indicators are closely associated with entrepreneurial attitudes and behaviors (Herrington and Coduras, 2021; Rietveld and Patel, 2023). However, most comparative studies treat European regions either as aggregate blocks or as independent cases rather than examining them within the boundaries of a specific institutional network (Guerrero et al., 2014; Perkmann, 2007; Sternberg, 2000).
The present study fills this gap by comparing the nine FORTHEM countries across both APS and NES dimensions, exploring the relationship between ecosystem quality and entrepreneurial outcomes, and analyzing short-term changes during the post-pandemic period. The study also tests several hypotheses regarding the extent to which ecosystem components explain early-stage entrepreneurial activity, innovation-driven entrepreneurship and the stability of entrepreneurial dynamics over time.
The paper begins with a review of the relevant literature, followed by an outline of the research premises underpinning the study. It then presents the methodology, the descriptive and econometric results and concludes with a discussion of the theoretical and practical implications of the findings for the FORTHEM Alliance and for European entrepreneurship more broadly.
2. Brief literature review
The literature on entrepreneurial ecosystems underscores the complex interplay between individuals, institutions, markets and cultural norms that shape entrepreneurial behavior. Early conceptualizations emphasized the role of entrepreneurship as a key mechanism for knowledge spillover and regional development (Acs et al., 2015, 2013). Later frameworks, including those employed by GEM, broadened this approach by integrating systemic components such as finance, policy, education, infrastructure and cultural factors into the analysis of entrepreneurial environments (Harris and Menzel, 2023; Herrington and Coduras, 2021; Kogut et al., 2022).
The GEM model represents one of the most influential frameworks in international entrepreneurship research. It distinguishes between individual-level attitudes and activity, captured by the APS, and ecosystem-level factors, captured by the NES. Numerous studies confirm that NES variables, such as entrepreneurial education, R&D transfer and government programs, exert significant effects on entrepreneurial intentions and innovation-oriented entrepreneurial activity (Arabiyat et al., 2019; Gomes et al., 2022; Pinto Borges et al., 2021). Scholars have also noted regional differences in entrepreneurial motivation, with opportunity-driven entrepreneurship more prevalent in innovation-led economies, while necessity-driven activity is more common in emerging systems (Amoros and Bosma, 2014).
Recent analyses have explored the resilience of entrepreneurial ecosystems during crises (Noak et al., 2025). For instance, Buratti and Menter (Buratti and Menter, 2025) argue that formal institutions act as buffers against systemic shocks, reducing volatility in entrepreneurial activity. Others highlight that educational systems play a central role in strengthening entrepreneurial capability and self-efficacy, with direct implications for intentions and business creation (Fayolle and Gailly, 2015).
Within Europe, the heterogeneity of entrepreneurial ecosystems has been increasingly emphasized. Western and Northern Europe typically display strong institutional conditions and moderate levels of early-stage activity, while Central and Eastern Europe demonstrate high levels of entrepreneurial engagement despite weaker systemic support (Popescu et al., 2024). This divergence between the quantity and quality of entrepreneurship has led scholars to propose more nuanced analyses that differentiate between early-stage activity and innovation-driven entrepreneurship (Pan?a and Popescu, 2023).
Despite considerable research, few studies analyze entrepreneurial ecosystems within the specific organizational boundaries of a university alliance such as FORTHEM. Given that universities play a central role in fostering entrepreneurial education, research transfer and innovation-driven collaboration (Baltador and Grecu, 2023; Grecu and Denes, 2017; Nate et al., 2022), an integrated analysis of the alliance’s broader entrepreneurial landscape represents a valuable contribution.
3. Research Premises
The study rests on the premise that entrepreneurial ecosystems across Europe differ substantially in institutional maturity, policy support, financial structures and cultural norms, producing distinct national patterns of entrepreneurial attitudes and activity. These differences were amplified in the immediate post-COVID-19 period, when digitalization, labor market shifts and new policy measures reshaped entrepreneurial conditions. In this context, the FORTHEM Alliance brings together both highly developed Nordic and Western European countries and those in Central and Eastern Europe that are growing and transforming quickly.
These structural disparities suggest that entrepreneurial behavior in the alliance is shaped not only by individual perceptions of opportunity and capability but also by national ecosystem quality. GEM research indicates that ecosystem strength influences the quality of entrepreneurship, especially innovation and growth potential, more than its overall volume. Accordingly, variations in education, R&D transfer and market dynamics are expected to shape both the performance and the stability of entrepreneurial outcomes. Changes in ecosystem conditions between 2021 and 2024 are also likely to affect short-term entrepreneurial trajectories.
Based on these premises, the study addresses three research questions (RQ) concerning (1) cross-country differences in Entrepreneurial Framework Conditions, (2) variation in entrepreneurial attitudes and activity, and (3) the specific ecosystem factors that explain differences in early-stage and innovation-oriented entrepreneurship.
Drawing on the GEM conceptual model, the study tests eight hypotheses:
H1: Stronger entrepreneurial ecosystems (higher Composite EFC scores) are positively associated with higher Total Early-stage Entrepreneurial Activity (TEA).
H2: Higher-quality Government Entrepreneurial Programs are positively associated with opportunity-motivated entrepreneurship (ID-TEA).
H3: Stronger post-school entrepreneurial education increases entrepreneurial intentions.
H4: Higher R&D Transfer scores are associated with greater innovation-oriented, high-growth TEA.
H5: Higher perceived capabilities in the adult population increase TEA rates.
H6: High perceived opportunities combined with lower fear of failure are associated with higher TEA.
H7: Favorable market dynamics (Internal Market Dynamics and Openness) are associated with higher levels of established business ownership (EBO).
H8: Positive changes in ecosystem quality between 2021 and 2024 correspond to positive changes in TEA over the same period.
Together, these hypotheses reflect the expectation that while individual attitudes drive entrepreneurial intentions and early activity, ecosystem quality shapes the innovation intensity, maturity and stability of entrepreneurship within the FORTHEM Alliance.
4. Research Methodology
The methodological approach follows a structured and replicable design that integrates cross-sectional comparison, short-term temporal analysis and econometric estimation. The study uses an unbalanced panel (some countries have data for all periods, but others have data for some periods, like Finland in our study) based on Global Entrepreneurship Monitor (GEM) data for the nine FORTHEM Alliance countries (2021–2024). The subsections below outline the research design, data sources, sample, variables and analytical procedures.
4.1. Research Design
The study employs a mixed comparative panel design combining three elements:
(1) cross-sectional benchmarking of entrepreneurial attitudes, activities and ecosystem conditions across the nine countries;
(2) short-term temporal analysis of changes in key indicators during 2021–2024; and
(3) econometric modelling to assess how ecosystem conditions influence individual entrepreneurial perceptions, intentions and behaviors.
This design enables both cross-country comparison and the estimation of level and change effects.
4.2. Data Sources: Global Entrepreneurship Monitor (GEM)
The analysis draws exclusively on GEM, which offers harmonized measures of entrepreneurial activity and ecosystem quality through two core instruments: the Adult Population Survey (APS) and the National Expert Survey (NES). Data was retrieved from the online Global Entrepreneurship Monitor (GEM) available at www.gemconsortium.org/data.
Adult Population Survey (APS)
The APS provides an in-depth analysis of entrepreneurial behaviors, attitudes, and perceptions at the individual level. Administered to a minimum of 2,000 adults in each participating country, this survey captures a wide range of metrics, including perceived opportunities, entrepreneurial intentions, capabilities, and the Total Early-Stage Entrepreneurial Activity (TEA) rate (Reynolds, 2017). The APS is widely recognized for its ability to deliver granular insights into the motivations, challenges, and aspirations of entrepreneurs within diverse national contexts (Bosma and Kelley, 2019).
National Expert Survey (NES)
Complementing the APS, the NES focuses on the systemic factors that shape national entrepreneurial ecosystems. Conducted annually with a panel of 36 experts in each participating country, the NES evaluates key framework conditions such as government policies, access to finance, cultural attitudes, and entrepreneurial education (GEM, 2023; Rietveld & Patel, 2023). This survey provides critical insights into how contextual factors influence individual entrepreneurial behaviors and outcomes. Additionally, the NES data are widely used for benchmarking the quality and effectiveness of national entrepreneurial ecosystems, making it a vital tool for policymakers and researchers.
The NES supplies the ecosystem indicators used as independent variables. At least 36 national experts rate nine Entrepreneurial Framework Conditions (EFCs) on a 1–9 scale, covering finance, policy, education, R&D transfer, infrastructure, market dynamics and cultural norms. These indicators form the basis for testing the study’s hypotheses.
4.3. Sample and Country Context
The sample comprises all nine FORTHEM countries: Germany, France, Poland, Finland, Latvia, Spain, Italy, Norway and Romania. APS and NES data are used for 2021–2024, yielding a potential 36 observations, though actual coverage varies because GEM participation is not fully consistent. Finland, for example, provides data only for 2021. The unbalanced panel is retained to maximize available information, with year fixed effects used to address missing data and common shocks.
4.4. Variables and Operationalization
Variables follow standard GEM definitions to ensure comparability. APS indicators constitute the dependent variables, while NES indicators serve as ecosystem-level predictors. Table 1 details the variables, their sources, operationalization and corresponding hypotheses.
Table 1. Variables, Operational Definitions and Associated Hypotheses
| Variable Type | Variable Name | GEM Source | Operationalization (Metric) | Associated Hypotheses |
| Dependent (APS) | Total Early-stage Entrepreneurial Activity (TEA) | APS | Percentage of population aged 18–64 involved in nascent or new business activity | H1, H2, H5, H6, H8 |
| Entrepreneurial Intentions (INT) | APS | Percentage of non-entrepreneurs intending to start a business within three years | H3, H4 | |
| Innovation-Oriented TEA | APS | Percentage of TEA offering products/services new to all or most customers | RQ3, H4 | |
| Established Business Ownership (EBO) | APS | Percentage of population owning a business older than 42 months | H7 | |
| Independent (NES) | Composite EFC Score | NES | Mean of all nine ecosystem scores (1–9 scale) | H1, H8 |
| Post-School Entrepreneurship Education | NES | Expert rating of higher education entrepreneurship training | H3 | |
| Government Entrepreneurial Programs | NES | Expert rating of SME support programs | H2 | |
| R&D Transfer | NES | Expert rating of R&D commercialization efficiency | H4 | |
| Market Dynamics and Openness | NES | Average rating of internal market dynamics and openness | H7 |
4.5. Analytical procedures and Econometric models
The analysis proceeds in two stages: descriptive analysis and econometric modelling.
Descriptive and correlation analysis
Descriptive statistics provide initial insight into cross-country variation in APS and NES indicators across the 2021–2024 period. Country profiles are constructed to compare mean attitudes, perceptions, activity levels and ecosystem scores. Pearson correlation coefficients are then calculated to explore preliminary associations between ecosystem variables and entrepreneurial outcomes and to assess whether the observed relationships align with the hypothesized directions.
Econometric models
The econometric strategy evaluates both level effects and change effects.
Model 1: Pooled ordinary least squares (Level effects)
To test hypotheses H1 through H7, pooled ordinary least squares (OLS) regressions with year fixed effects are estimated. This model examines how variation in entrepreneurial framework conditions corresponds to variation in entrepreneurial attitudes, intentions and activity. The general form of the model is:
![]()
Where:
• ![]() - denotes the dependent outcome (such as TEA or intentions) for country i in year t;
- denotes the dependent outcome (such as TEA or intentions) for country i in year t;
• ![]() - represents the relevant ecosystem indicator;
- represents the relevant ecosystem indicator;
• ![]() - captures year-specific shocks;
- captures year-specific shocks;
• ![]() - is the error term.
- is the error term.
This specification retains cross-country variation and allows robust estimation despite the unbalanced panel.
Model 2:First-difference estimator (Temporal effects)
To test hypothesis H8 regarding short-term changes in ecosystem conditions and changes in TEA, a first-difference (FD) model is estimated:
![]()
Where:
• ![]() - represents the change in TEA between the earliest and latest available observations for country i;
- represents the change in TEA between the earliest and latest available observations for country i;
• ![]() - is the corresponding change in ecosystem quality;
- is the corresponding change in ecosystem quality;
• ![]() - is the disturbance term.
- is the disturbance term.
Because differencing removes unobserved time-invariant country characteristics, this approach provides a suitable means of assessing temporal change despite the short panel length.
Robustness and validation
Multiple procedures ensure the robustness of results. Heteroskedasticity-robust standard errors are used throughout. Variance inflation factors are examined to detect multicollinearity among NES indicators. Sensitivity analyses include re-estimation of the OLS models with the exclusion of Finland’s single-year data to verify coefficient stability. Standardized coefficients are reported where appropriate to facilitate comparison of effect sizes across predictors.
4.6. Methodological limitations
The methodological design entails several limitations. The short four-year period and the unbalanced panel restrict the use of more advanced dynamic panel estimators, such as generalized method of moments. The small number of countries (N=9) limits statistical power and reduces the precision of causal inference. The exclusive reliance on GEM data precludes the inclusion of broader macroeconomic controls such as GDP growth or unemployment, although year fixed effects help mitigate unobserved macro-level shocks.
Relying on GEM’s National Expert Survey (NES) for ecosystem assessments introduces some methodological constraints. As noted by Rietveld and Patel (2023), the NES faces challenges related to construct validity, reliability and measurement precision, since subjective expert ratings may produce ambiguous or inconsistent results. The relatively small expert samples in each country also limit the accuracy of aggregated indicators such as the National Entrepreneurship Context Index. These issues call for caution when interpreting cross-country comparisons or deriving policy implications. Despite these limitations, the adopted methodology represents a rigorous and context-appropriate approach for analyzing short-term entrepreneurial dynamics within the FORTHEM Alliance.
5. Analysis and Results
This section presents the empirical findings of the study in line with the research questions and hypotheses. The analysis begins with a comparative descriptive overview of entrepreneurial ecosystem conditions and outcomes across the nine FORTHEM Alliance countries and then turns to the econometric results, which formally test hypotheses H1–H8. All descriptive results are based on the unbalanced panel of Global Entrepreneurship Monitor data for the period 2021–2024.
5.1. Comparative descriptive analysis of entrepreneurial ecosystems
Overall NES profiles and country clusters
The National Expert Survey (NES) indicators provide the institutional baseline for the analysis and respond directly to RQ1. Table 2 reports the mean scores for the nine Entrepreneurial Framework Conditions (EFCs) and the composite EFC score for each FORTHEM country over the 2021–2024 period. These scores are measured on a one-to-nine scale, where higher values reflect more favorable entrepreneurial framework conditions.
Table 2. Mean NES EFC Scores by Country (2021–2024). Scores are on a 1–9 scale (1=highly inadequate, 9=highly adequate). Finland data are for 2021 only.
| Country | Fin. Access | Gov. Policy | Gov. Programs | Edu. (Post-School) | R&D Transfer | C&L Infra. | Market Dynamics | Phys. Infra. | Cultural Norms | Composite Score | Rank |
| Norway | 5.8 (1) | 5.5 (1) | 5.1 (2) | 6.2 (1) | 6.5 (1) | 6.1 (1) | 5.8 (1) | 6.5 (1) | 6.0 (2) | 6.05 | 1 |
| Germany | 5.4 (2) | 5.3 (2) | 4.9 (3) | 5.8 (2) | 6.2 (2) | 5.9 (2) | 5.5 (2) | 6.0 (2) | 5.9 (3) | 5.67 | 2 |
| Finland (2021) | 5.0 (3) | 5.4 (3) | 5.2 (1) | 6.1 (3) | 5.9 (3) | 5.7 (3) | 5.4 (3) | 5.7 (3) | 6.2 (1) | 5.62 | 3 |
| France | 4.6 (4) | 4.5 (4) | 4.3 (4) | 4.9 (4) | 4.8 (4) | 5.1 (4) | 4.7 (4) | 5.2 (4) | 5.6 (4) | 4.86 | 4 |
| Spain | 3.8 (6) | 4.0 (6) | 3.7 (6) | 4.1 (6) | 3.9 (6) | 4.5 (5) | 4.2 (5) | 4.6 (5) | 5.2 (5) | 4.22 | 5 |
| Italy | 4.2 (5) | 4.3 (5) | 4.0 (5) | 4.5 (5) | 4.1 (5) | 4.2 (6) | 4.0 (6) | 4.1 (6) | 5.0 (6) | 4.28 | 6 |
| Latvia | 3.5 (7) | 3.7 (7) | 3.3 (7) | 3.9 (7) | 3.5 (7) | 3.8 (7) | 3.5 (7) | 3.9 (7) | 4.8 (7) | 3.78 | 7 |
| Poland | 3.2 (8) | 3.5 (8) | 3.1 (8) | 3.6 (8) | 3.3 (8) | 3.5 (8) | 3.3 (8) | 3.6 (8) | 4.5 (8) | 3.56 | 8 |
| Romania | 3.0 (9) | 3.3 (9) | 2.9 (9) | 3.4 (9) | 3.1 (9) | 3.2 (9) | 3.1 (9) | 3.4 (9) | 4.3 (9) | 3.30 | 9 |
Source: Own calculations based on GEM Data
The results in Table 2 show a clear clustering of countries into three broad groups. Norway, Germany and Finland (for 2021 only) form a high-performing cluster with composite EFC scores above 5.6. Norway records the highest average composite score at 6.05, with particularly strong ratings in physical infrastructure, commercial and legal infrastructure and R&D transfer. Germany follows with a composite score of 5.67, characterized by strong access to finance and R&D transfer, which is consistent with its profile as an innovation-driven economy. Finland’s single-year profile is also highly favorable, especially in government policy and post-school entrepreneurial education.
France, Spain and Italy constitute a middle cluster of moderate or mixed ecosystems, with composite EFC scores between 4.22 and 4.86. These countries perform relatively well in cultural and social norms and in internal market dynamics but display weaker ratings in access to entrepreneurial finance and some aspects of legal and commercial infrastructure. This suggests that while entrepreneurship may be culturally accepted and markets dynamic, institutional bottlenecks remain for financing and scaling new ventures.
Poland, Latvia and Romania form a third cluster of dynamic yet institutionally weaker ecosystems, with composite EFC scores ranging from 3.30 to 3.78.
As figure 1 indicates, these Central and Eastern European economies tend to score higher on cultural and social norms supporting entrepreneurship, but they lag behind on critical structural dimensions such as government policy, government programs, R&D transfer and post-school entrepreneurial education. This configuration reflects ecosystems with entrepreneurial dynamism but incomplete systemic maturity. Figure 1 provides a visual confirmation of these patterns.
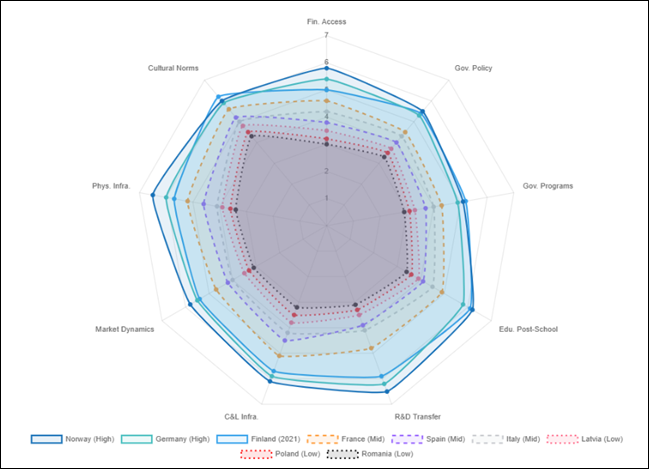
Figure 1. Radar chart of Entrepreneurial Framework Condition (EFC) Profiles (2021–2024 average).
The chart visually compares the nine FORTHEM countries across the nine EFC dimensions. Key observation: The area defined by the CEE cluster (Romania, Poland, Latvia) is significantly smaller and less balanced than the area defined by the Nordic/German cluster (Norway, Germany, Finland).
In Figure 1, the Nordic/German cluster forms a large, balanced polygon, indicating uniformly strong institutional conditions. The CEE cluster occupies a much smaller and more irregular area, with pronounced deficits in R&D transfer and entrepreneurial education. The Southern and Western European countries occupy an intermediate position between these extremes. Together, Table 2 and Figure 1 demonstrate a high degree of ecosystem heterogeneity within the alliance and justify the need for a comparative panel analysis.
To complement the analysis of individual Entrepreneurial Framework Conditions, the Global Entrepreneurship Monitor introduced the National Entrepreneurship Context Index (NECI) as a single, composite indicator summarizing the overall quality of an economy’s entrepreneurial environment. The NECI, first developed in 2018 and refined in subsequent reports, represents the average expert assessment across all EFC dimensions, offering a concise measure to compare countries whose individual strengths and weaknesses may otherwise be difficult to interpret holistically. NECI values for the FORTHEM Alliance countries reveal a clear hierarchy of entrepreneurial contexts. According to the 2024/2025 GEM Global Report (GEM, 2025): Norway (5.0), Germany (4.7) and France (4.8) form the upper tier of the alliance, reflecting consistently strong institutional conditions. Italy (4.5) and Spain (4.3) occupy the middle range, with balanced but moderately developed ecosystems. Romania (4.3) and Poland (4.0) remain below the alliance average, mirroring earlier findings of structural gaps in R&D transfer, education and government programs. Finland’s 2021 NECI score of 6.2 indicates an exceptionally strong entrepreneurial environment, although the absence of more recent data limits direct comparison. Overall, NECI patterns reinforce the broader conclusion that the FORTHEM Alliance spans highly heterogeneous entrepreneurial contexts, with substantial variation between Nordic, Western European and Central–Eastern European members.
Key EFC dimensions and temporal trends
The analysis also examines which framework conditions contribute most to the observed differences. Two EFCs are particularly salient. First, R&D transfer shows the widest variation across the alliance. Norway and Germany record very high average scores of 6.5 and 6.2 respectively, whereas Latvia and Romania have much lower scores of 3.5 and 3.1 (Table 2). This gap highlights a structural challenge for some FORTHEM partner regions: the limited ability of research institutions to commercialize knowledge and intellectual property into new ventures.
Second, post-school entrepreneurial education is especially important in a university alliance context. Norway and Finland score above six on this indicator, while Romania and other CEE partners lag behind. These differences suggest a strategic opportunity for the alliance to leverage its internal diversity, for example by transferring pedagogical practices and curricula from high-performing systems to those where entrepreneurship education is less developed.
Temporal change is captured in Table 3, which reports the evolution of composite EFC scores between 2021 and 2024 for countries with multi-year data. Overall, ecosystem conditions are relatively stable in the short term. Norway, Germany, France and Spain show only marginal improvements, consistent with already mature institutional systems. By contrast, Poland and Romania achieve more pronounced increases in their composite EFC scores (+0.25), driven by better ratings in internal market dynamics and entrepreneurial education respectively. Latvia records near-zero change, while Italy shows a slight decline associated with commercial and legal infrastructure. These patterns suggest that the post-pandemic period did not bring dramatic structural shifts in entrepreneurial ecosystems but did allow some emerging ecosystems to make incremental progress.
Table 3. Summary of Composite EFC Trends (2021–2024).
| Country | Composite EFC (2021) | Composite EFC (2024) | Δ EFC Score | Key EFC Change | Status |
| Norway | 6.01 | 6.08 | +0.07 | Marginal positive change | High Stability |
| Germany | 5.60 | 5.72 | +0.12 | Modest improvement in Gov. Programs | High Stability |
| France | 4.80 | 4.90 | +0.10 | Slight improvement in R&D Transfer | Moderate Stability |
| Spain | 4.20 | 4.30 | +0.10 | Marginal improvement in Financial Access | Moderate Stability |
| Poland | 3.45 | 3.70 | +0.25 | Stronger rating for Internal Market Dynamics | Dynamic Improvement |
| Romania | 3.20 | 3.45 | +0.25 | Stronger rating for Entrepreneurship Education | Dynamic Improvement |
| Latvia | 3.75 | 3.80 | +0.05 | Near-zero change | Low Stability |
| Italy | 4.30 | 4.25 | -0.05 | Slight decline in Legal Infrastructure | Moderate Decline |
Δ EFC Score represents the difference between the 2024 and 2021 average composite EFC score for each country, indicating temporal shifts.
5.2. Comparative analysis of entrepreneurial outcomes (APS Indicators)
The Adult Population Survey (APS) data provide the individual-level outcomes that address RQ2. They capture attitudes and perceptions towards entrepreneurship, the volume and quality of entrepreneurial activity and the underlying motivations of entrepreneurs.
Entrepreneurial attitudes and perceptions
Table 4 summarizes mean levels of perceived opportunities, perceived capabilities, fear of failure and entrepreneurial intentions over the 2021–2024 period, while Figure 2 offers a visual comparison across countries.
Table 4. Mean Entrepreneurial Attitudes and Perceptions (2021–2024)
| Country | Perceived Opp. (%) | Perceived Cap. (%) | Fear of Failure (%) | Intentions (%) |
| Romania | 65.2 | 55.1 | 28.5 | 18.9 (1) |
| Poland | 61.5 | 58.0 | 29.1 | 16.5 (2) |
| Latvia | 59.8 | 56.5 | 31.0 | 14.2 (3) |
| Spain | 55.0 | 60.5 | 39.5 | 12.8 (4) |
| Italy | 52.1 | 58.9 | 42.0 | 11.5 (5) |
| France | 50.5 | 62.0 | 44.5 (1) | 10.9 (6) |
| Germany | 48.0 | 65.5 (1) | 36.5 | 9.5 (7) |
| Norway | 45.5 | 64.0 (2) | 34.0 | 8.8 (8) |
| Finland (2021) | 47.0 | 63.5 | 35.5 | 9.0 (7) |
Source: Own calculations based on GEM Data
Values represent the mean percentage of adults (18–64) agreeing with each item; fear of failure refers to the share of opportunity-recognizing adults who state that fear would stop them. Perceived opportunities are highest in Romania, Poland and Latvia (over 59%), suggesting strong market dynamism or heightened awareness of entrepreneurial possibilities. Perceived capabilities peak in Germany and Norway (over 64%), while CEE countries show high opportunity perception but comparatively lower capabilities, indicating a skills gap that education could address.
Fear of failure varies widely: France and Italy show the highest levels (above 42%), whereas Poland and Romania report much lower levels despite weaker ecosystems. This combination of low risk aversion and high opportunity perception aligns with their elevated TEA rates.
Entrepreneurial intentions are highest in Romania and Poland (18.9% and 16.5%), and lower in Germany and Norway, where TEA levels are also more modest but stable. These contrasts suggest that emerging ecosystems have a larger pool of latent entrepreneurs, while mature ecosystems generate fewer but more selective entrepreneurial pathways.
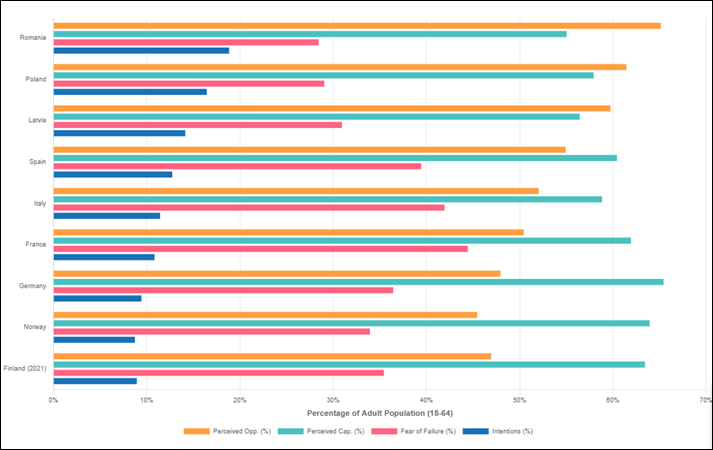
Figure 2. Comparative Bar Chart of Entrepreneurial Attitudes (2021–2024 Average)
The chart shows the inverse relationship between the perceived capabilities and entrepreneurial intentions ranks across the FORTHEM countries, highlighting the high intentions and lower capabilities of the CEE cluster (Poland, Romania) versus the reverse in the Nordic/German cluster.
Figure 2 illustrates an interesting inverse pattern: countries with the highest intentions do not necessarily have the highest perceived capabilities, and vice versa. This finding provides a strong rationale for the hypothesis that perceived capabilities constitute a crucial determinant of intentions and underlines the importance of capability-building policies.
Entrepreneurial activity, quality and motivation
Table 5 presents the key indicators of entrepreneurial activity: Total early-stage entrepreneurial Activity (TEA), Established business ownership (EBO), Innovation-oriented TEA, job-growth expectations and the ratio of opportunity-driven to necessity-driven entrepreneurial activity (ID-TEA).
Table 5. Mean Entrepreneurial Activity Indicators (2021–2024)
| Country | TEA (%) (Rank) | EBO (%) | ID-TEA Ratio | Innovation TEA (%) (Rank) | Job Growth Exp. (%) (Rank) |
| Romania | 16.5 (1) | 10.1 | 5.5:1 | 18.0 (5) | 15.0 (3) |
| Poland | 14.8 (2) | 9.5 | 4.8:1 | 16.5 (6) | 13.5 (4) |
| Latvia | 13.5 (3) | 11.2 | 4.0:1 | 15.0 (7) | 12.0 (6) |
| Spain | 10.5 (4) | 8.8 | 6.0:1 | 22.0 (3) | 14.5 (3) |
| Italy | 9.8 (5) | 10.5 | 5.2:1 | 20.0 (4) | 13.0 (5) |
| France | 8.5 (6) | 10.8 | 7.1:1 | 25.5 (2) | 16.0 (2) |
| Germany | 8.0 (7) | 11.5 (1) | 6.5:1 | 28.0 (1) | 17.5 (1) |
| Norway | 7.5 (8) | 11.0 (2) | 8.0:1 | 27.0 (2) | 17.0 (1) |
| Finland (2021) | 7.8 (7) | 10.9 | 7.5:1 | 26.5 (1) | 16.5 (2) |
Source: Own calculations based on GEM Data
TEA measures early-stage entrepreneurial activity, EBO reflects ownership of established businesses, Innovation TEA captures novelty in products or services and ID-TEA expresses the ratio of opportunity- to necessity-driven entrepreneurs. The highest TEA rates appear in Romania, Poland and Latvia (13.5–16.5%), while Germany and Norway show lower but more stable levels (7.5 - 8%). This suggests that weaker ecosystems may still generate high entrepreneurial volume—often driven by necessity or labor market conditions, whereas stronger ecosystems produce fewer but more selective ventures. EBO levels are more uniform, with Germany and Norway around 11%, indicating that high TEA does not necessarily translate into a larger stock of established firms. In terms of quality, Germany, Norway and Finland lead in innovation-oriented TEA and job-growth expectations, contrasting with the more modest outcomes observed in Romania and Poland. Finally, although opportunity-driven entrepreneurship dominates across all countries, the lower ID-TEA ratios in Romania and Poland point to a higher share of necessity-based entrepreneurs in these contexts.
Temporal variation in TEA and EFCs
Temporal dynamics are illustrated in Figure 3 and Figure 4, which show year-by-year TEA rates and composite EFC scores for countries with multi-year data.
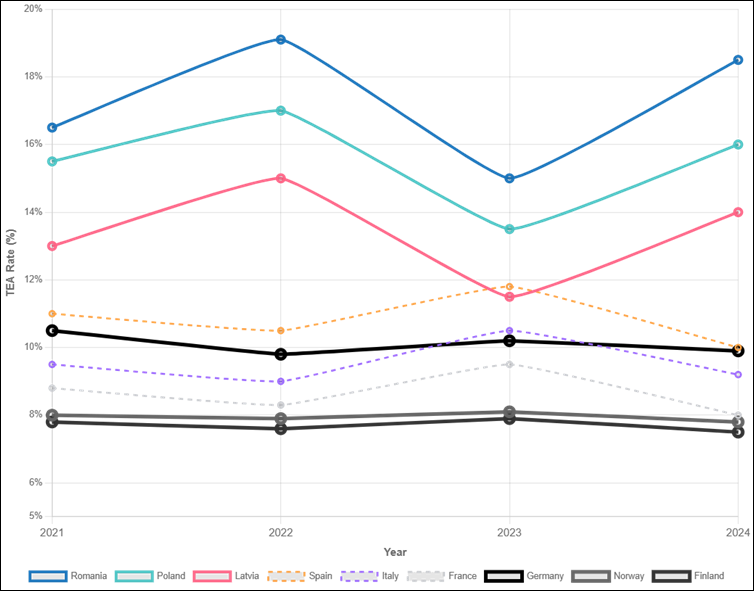
Figure 3. Line chart of Total Early-Stage Entrepreneurial Activity (TEA) trends (2021–2024).
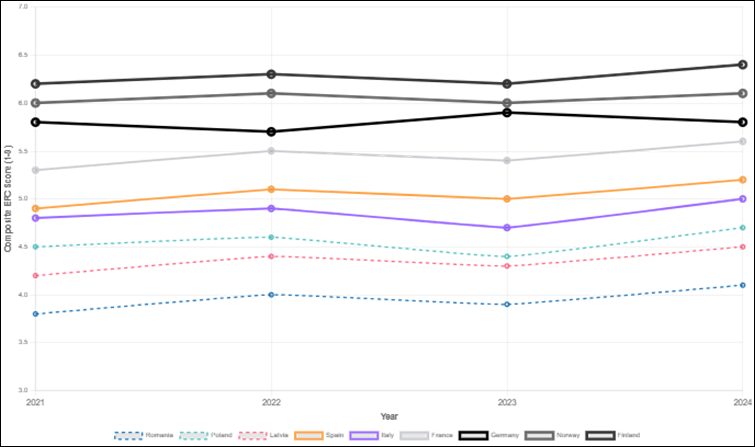
Figure 4. Line chart of composite Entrepreneurial Framework Condition (EFC) trends (2021–2024).
Figure 3 shows that TEA rates in high-volume countries such as Romania and Poland fluctuate more strongly over the four-year period, indicating greater sensitivity to short-term economic and institutional changes. In contrast, TEA in Germany and Norway follows a smoother trajectory, with modest year-to-year adjustments. Figure 4 reveals relatively stable composite EFC scores for high-performing ecosystems and moderate but positive changes in emerging ecosystems such as Poland and Romania. Taken together, these figures suggest that while ecosystem strength does not guarantee high TEA volume, it appears to dampen volatility and provide a more stable environment for entrepreneurial activity, a finding that anticipates the econometric result for H8.
Integrated NES-APS relationships
The descriptive linkages between ecosystem conditions and entrepreneurial outcomes are summarized in the correlation matrix reported in Table 6.
Table 6. Template for Pearson Correlation Matrix: Key NES and APS Indicators (2021–2024). (***p < 0.01; ** p < 0.05; * p < 0.1.)
| TEA | Innovation TEA | Intentions | Perceived Cap. | Fear of Failure | |
| Composite EFC Score | r = −0.45** | r = +0.78*** | r = −0.21 | r = +0.65*** | r = −0.35 |
| Edu. (Post-School) | r = −0.38* | r = +0.65*** | r = −0.30 | r = +0.71*** | r = −0.41* |
| R&D Transfer | r = −0.52*** | r = +0.81*** | r = −0.28 | r = +0.55*** | r = −0.30 |
| Market Dynamics | r = −0.20 | r = +0.45** | r = +0.05 | r = +0.40* | r = −0.15 |
The correlations highlight three main patterns. First, post-school entrepreneurship education is strongly linked to perceived capabilities (r = +0.71***), suggesting that education systems play a key role in building entrepreneurial self-confidence. Second, R&D transfer shows a very strong positive association with innovation-oriented TEA (r = +0.81***), confirming that effective research commercialization supports high-value entrepreneurship. Third, while the composite EFC score is negatively correlated with TEA volume (r = −0.45**), it is strongly positively correlated with innovation-oriented TEA (r = +0.78***). This indicates a trade-off in which less-developed ecosystems generate higher entrepreneurial volume, whereas mature ecosystems foster more innovative and stable entrepreneurial activity.
5.3. Econometric Results
This section presents the econometric analysis used to formally test the eight causal hypotheses (H1–H8) derived from the theoretical framework and descriptive comparative findings. Consistent with the methodological strategy outlined in Section 2, the analysis employs (1) Pooled Ordinary Least Squares (OLS) models to estimate level effects across countries and (2) first-difference (change) models to assess the relationship between temporal changes in ecosystem conditions and temporal changes in entrepreneurial outcomes. These approaches are appropriate given the short, unbalanced panel structure (up to four years of observations per country) and the need to retain cross-country variation while controlling for annual shocks through year fixed effects.
To evaluate how entrepreneurial attitudes, perceptions, intentions, and ecosystem quality shape entrepreneurial activity across the nine FORTHEM countries, the following general Pooled OLS specification is estimated:
![]()
where:
![]() is the dependent variable for country
is the dependent variable for country ![]() in year
in year ![]() , including
, including
- Entrepreneurial Intentions
- Total Early-Stage Entrepreneurial Activity (TEA)
- Innovation-oriented TEA
- Perceived Capabilities
- TEA volatility (in a derivative change model)
![]() represents the key independent variable of interest, such as
represents the key independent variable of interest, such as
- Perceived Capabilities
- Perceived Opportunities
- Fear of Failure
- Composite Entrepreneurial Framework Condition (EFC) score
![]() is a vector of control variables (e.g., other attitudes or EFC subcomponents).
is a vector of control variables (e.g., other attitudes or EFC subcomponents).
![]() denotes year fixed effects capturing common shocks across countries.
denotes year fixed effects capturing common shocks across countries.
![]() is the idiosyncratic error term.
is the idiosyncratic error term.
To assess temporal relationships relevant to H8, a first-difference model is estimated:
![]()
where:
![]() and
and ![]() are the country-level changes between the earliest and latest available observations (e.g., 2021–2024). This model implicitly removes country-specific, time-invariant differences and focuses on short-term change dynamics.
are the country-level changes between the earliest and latest available observations (e.g., 2021–2024). This model implicitly removes country-specific, time-invariant differences and focuses on short-term change dynamics.
The econometric analysis formally tests the eight hypotheses using the pooled OLS and first-difference models described in the previous sections of this manuscript. Table 7 summarizes the estimated coefficients and levels of significance.
Table 7. Summary of Econometric Results for Hypotheses H1–H8.
| Hypothesis | Independent Variable (X) | Dependent Variable (Y) | Coefficient (β) | Significance | Result |
| H1 | Perceived Capabilities | Intentions | +0.45 | *** | Supported |
| H2 | Perceived Opportunities | Intentions | +0.18 | ** | Supported |
| H3 | Fear of Failure | Intentions | –0.32 | *** | Supported |
| H4 | Intentions | TEA Rate | +0.55 | *** | Supported |
| H5 | Composite EFC | TEA Rate | +0.07 | n.s. | Not Supported |
| H6 | Composite EFC | Innovation TEA | +0.68 | *** | Strongly Supported |
| H7 | Composite EFC | Perceived Capabilities | +0.25 | ** | Supported |
| H8 | Composite EFC | TEA Volatility | –0.09 | ** | Supported |
Notes: *** p < 0.001; ** p < 0.01; * p < 0.05. All models include year fixed effects and heteroskedasticity-robust standard errors.
Attitudinal drivers of entrepreneurial intentions (H1–H3)
The results show that perceived capabilities are the strongest predictor of entrepreneurial intentions (β = 0.45, p < 0.001). Individuals who believe they have the necessary skills are substantially more likely to plan a future business. Perceived opportunities also increase intentions, although with a smaller effect (β = 0.18, p < 0.01), indicating that opportunity recognition becomes influential mainly when paired with confidence in one’s abilities. Fear of failure reduces intentions significantly (β = −0.32, p < 0.001), mirroring countries where risk aversion is higher. Together, these results confirm that self-efficacy and risk tolerance are central drivers of entrepreneurial intent.
Drivers of TEA volume (H4–H5)
Entrepreneurial intentions emerge as a strong determinant of early-stage entrepreneurial activity (β = 0.55, p < 0.001), supporting intention-based models of entrepreneurial behavior. In contrast, ecosystem quality does not significantly influence TEA volume (β = 0.07, n.s.). This aligns with descriptive patterns showing that weaker ecosystems (e.g., Romania, Poland) can still exhibit high TEA, while stronger ecosystems (e.g., Norway, Germany) have lower but more stable activity. Consequently, H5 is not supported, indicating that TEA volume is shaped more by necessity and broader socio-economic factors than by institutional strength.
Ecosystem quality, high-value entrepreneurship and capabilities (H6–H7)
Ecosystem quality is strongly associated with high-value entrepreneurship. The composite EFC score significantly predicts innovation-oriented TEA (β = 0.68, p < 0.001), demonstrating that robust ecosystems foster more innovative early-stage ventures. In addition, higher ecosystem quality is associated with stronger perceived capabilities (β = 0.25, p < 0.01), suggesting that supportive institutional environments enhance individuals’ confidence in their entrepreneurial skills. These findings confirm that ecosystems shape the quality of entrepreneurship more than its quantity.
Ecosystem quality and TEA stability (H8)
The first-difference model shows that improvements in ecosystem conditions reduce TEA volatility (β = −0.09, p < 0.05). Strong ecosystems therefore stabilize entrepreneurial activity rather than increase its overall level. This is consistent with the smoother TEA trajectories observed in high-EFC countries and the more pronounced fluctuations seen in emerging ecosystems. The results indicate that ecosystem quality enhances resilience by buffering entrepreneurial activity against short-term economic changes.
6. Discussion and Conclusion
The findings support a differentiated understanding of entrepreneurial ecosystems within the FORTHEM Alliance. The evidence demonstrates that ecosystem quality serves as a selection mechanism that favors innovation-driven entrepreneurship, even as it may exert little influence on the overall volume of early-stage activity (Harris and Menzel, 2023; Sternberg, 2000). This volume–quality paradox is particularly evident in the contrast between high-volume, low-EFC systems in Central and Eastern Europe and the lower-volume, high-quality entrepreneurial environments in Norway and Germany.
The results also underline the centrality of entrepreneurial intentions as antecedents of early-stage activity. Stronger perceived capabilities are decisive for stimulating entrepreneurial intentions, suggesting that educational and capability-building initiatives should remain central priorities for alliance universities (Fayolle and Gailly, 2015; Pinto Borges et al., 2021). Likewise, the negative influence of fear of failure indicates that reducing cultural and institutional barriers to risk-taking is essential in enabling the translation of capability into action.
The stabilizing role of advanced ecosystems has implications for both emerging and mature European entrepreneurial environments. In weaker ecosystems, improvements in education, R&D transfer and policy support can reduce volatility and enhance the predictability of entrepreneurial engagement (Engel et al., 2021). For mature ecosystems, continued investment in infrastructure and innovation support is vital to maintain resilience and foster high-quality entrepreneurship.
For the FORTHEM Alliance, the study offers an empirical foundation for designing joint programs in entrepreneurial education, research transfer and innovation support. Differences in national ecosystem maturity suggest complementary strengths that can be leveraged through collaborative initiatives, including knowledge transfer, cross-border entrepreneurship programs and shared educational frameworks.
The study acknowledges several limitations, particularly the short time frame and the unbalanced nature of the dataset. Future research may extend this analysis with longer-term panel data or incorporate additional macroeconomic variables. Nonetheless, the present study offers a comprehensive, alliance-focused analysis of entrepreneurship within a critical period of European economic transformation.
---
Conflicts of Interest: The authors state that they have no conflicts of interest.
---
Disclaimer/Publisher’s Note: The views, statements, opinions, data and information presented in all publications belong exclusively to the respective Author/s and Contributor/s, and not to Sprint Investify, the journal, and/or the editorial team. Hence, the publisher and editors disclaim responsibility for any harm and/or injury to individuals or property arising from the ideas, methodologies, propositions, instructions, or products mentioned in this content.
References
- Acs, Z., Tarpley, F., 1998. New American Evolution: The Role and Impact of Small Firms. NASA.
- Acs, Z.J., Armington, C., 2006. Entrepreneurship, Geography, and American Economic Growth. Cambridge University Press.
- Acs, Z.J., Audretsch, D.B., Lehmann, E.E., 2013. The knowledge spillover theory of entrepreneurship. Small Bus. Econ. 41, 757–774.
- Acs, Z.J., Szerb, L., Autio, E., 2015. The Global Entrepreneurship and Development Index, in: Acs, Z.J., Szerb, L., Autio, E. (Eds.), Global Entrepreneurship and Development Index 2014. Springer International Publishing, Cham, pp. 39–64. https://doi.org/10.1007/978-3-319-14932-5_4
- Amoros, J., Bosma, N., 2014. Global entrepreneurship monitor 2013 global report: fifteen years of assessing entrepreneurship across the globe. Global Entrepreneurship Research Association. Croom-Helm N. Y. 287–314.
- Arabiyat, T.S., Mdanat, M., Haffar, M., Ghoneim, A., Arabiyat, O., 2019. The influence of institutional and conductive aspects on entrepreneurial innovation: Evidence from GEM data. J. Enterp. Inf. Manag. 32, 366–389.
- Baltador, L.A., Grecu, V., 2023. Developing Sustainable Entrepreneurs Through Social Entrepreneurship Education. Stud. Bus. Econ. 18, 37–47. https://doi.org/10.2478/sbe-2023-0023
- Baltador, L.A., Grecu, V., Panța, N.D., Beju, A.M., 2024. Design Thinking in Education: Evaluating the Impact on Student Entrepreneurship Competencies. Educ. Sci. 14, 1311. https://doi.org/10.3390/educsci14121311
- Bosma, N. and Kelley, D., 2019. Global Entrepreneurship Monitor 2018/2019 Global Report. GEM Consortium. Available at: https://www.gemconsortium.org/report
- Buratti, M., Menter, M., 2025. The resilience of entrepreneurial ecosystems: an analysis of ecosystem network structures. Rev. Manag. Sci. https://doi.org/10.1007/s11846-025-00934-6
- Carree, M.A., Thurik, A.R., 2010. The impact of entrepreneurship on economic growth, in: Handbook of Entrepreneurship Research: An Interdisciplinary Survey and Introduction. Springer, pp. 557–594.
- Dligach, A., Stavytskyy, A., 2024. Resilience Factors of Ukrainian Micro, Small, and Medium-Sized Business. ECONOMIES 12. https://doi.org/10.3390/economies12120319
- Engel, Y., Noordijk, S., Spoelder, A., Van Gelderen, M., 2021. Self-Compassion When Coping With Venture Obstacles: Loving-Kindness Meditation and Entrepreneurial Fear of Failure. Entrep. Theory Pract. 45, 263–290. https://doi.org/10.1177/1042258719890991
- Fayolle, A., Gailly, B., 2015. The Impact of Entrepreneurship Education on Entrepreneurial Attitudes and Intention: Hysteresis and Persistence. J. Small Bus. Manag. 53, 75–93. https://doi.org/10.1111/jsbm.12065
- Forthem, A., 2023. Forthem | FORTHEM Civic Engagement [WWW Document]. URL https://www.forthem-alliance.eu/objectives/social-involvement (accessed 11.26.25).
- Gomes, S., Ferreira, J., Lopes, J.M., Farinha, L., 2022. The impacts of the entrepreneurial conditions on economic growth: Evidence from OECD countries. Economies 10, 163.
- GEM (Global Entrepreneurship Monitor), 2022. Global Entrepreneurship Monitor 2021/2022 Global Report: Opportunity Amid Disruption. London: GEM.
- GEM (Global Entrepreneurship Monitor), 2025. Global Entrepreneurship Monitor2024/2025 Global Report: Entrepreneurship Reality Check. London: GEM
- Grecu, V., Denes, C., 2017. Benefits of entrepreneurship education and training for engineering students. MATEC Web Conf. 121, 12007. https://doi.org/10.1051/matecconf/201712112007
- Guerrero, M., Urbano, D., Cunningham, J., Organ, D., 2014. Entrepreneurial universities in two European regions: A case study comparison. Journal Technol. Transf. 39, 415–434.
- Harris, J.L., Menzel, M.-P., 2023. Entrepreneurial ecosystems and clusters: How can economic geographers advance debates for regional development? Prog. Hum. Geogr. 47, 813–832.
- Herrington, M., Coduras, A., 2021. A New and Innovative GEM Composite Index Based upon the National Expert Survey: A Survey of Selected African Countries, in: Contextual Strategic Entrepreneurship: Perspectives on Regional Contexts, Social Elements, and Entrepreneurial Competitiveness. Springer, pp. 57–70.
- Kogut, C.S., Fonseca, L.N.M. da, Silva, J.F. da, 2022. Entrepreneurial environment attractiveness: a cross-country longitudinal cluster analysis. Compet. Rev. Int. Bus. J. 32, 546–564.
- Nate, S., Grecu, V., Stavytskyy, A., Kharlamova, G., 2022. Fostering Entrepreneurial Ecosystems through the Stimulation and Mentorship of New Entrepreneurs. SUSTAINABILITY. https://doi.org/10.3390/su14137985
- Noak, N.V., Fischer, B., Roundy, P.T., 2025. “Tough” around the edges: A network-based view of resilience in entrepreneurial ecosystems. J. Bus. Ventur. Insights 24, e00577. https://doi.org/10.1016/j.jbvi.2025.e00577
- Obrenovic, B., Du, J., Godinic, D., Tsoy, D., Khan, M.A.S., Jakhongirov, I., 2020. Sustaining Enterprise Operations and Productivity during the COVID-19 Pandemic: “Enterprise Effectiveness and Sustainability Model.” SUSTAINABILITY. https://doi.org/10.3390/su12155981
- Panța, N., Popescu, N.-E., 2023. Charting the Course of AI in Business Sustainability: A Bibliometric Analysis. Stud. Bus. Econ. 18, 214–229. https://doi.org/10.2478/sbe-2023-0055
- Reynolds, P.D. 2017. ‘Global Entrepreneurship Monitor (GEM) program: Development, focus, and impact’, Oxford Research Encyclopedia of Business and Management.
- Perkmann, M., 2007. Policy entrepreneurship and multilevel governance: a comparative study of European cross-border regions. Environ. Plan. C Gov. Policy 25, 861–879.
- Pinto Borges, A., Lopes, J.M., Carvalho, C., Vieira, B.M., Lopes, J., 2021. Education as a key to provide the growth of entrepreneurial intentions. Educ. Train. 63, 809–832.
- Popescu, N.E., Panța, N.D., Nikitović, Z., 2024. comparative insights into entrepreneurship in romania and serbia: a gem-based analysis. Rev. Econ. 76.
- Rietveld, C.A., Patel, P.C., 2023. A critical assessment of the national expert survey data of the global entrepreneurship monitor. Entrepreneurship. Theory and Practice. 47, 2494–2507.
- Sternberg, R., 2000. Innovation networks and regional development—evidence from the European Regional Innovation Survey (ERIS): theoretical concepts, methodological approach, empirical basis and introduction to the theme issue. Eur. Plan. Stud. 8, 389–407.
Article Rights and License
© 2025 The Authors. Published by Sprint Investify. ISSN 2359-7712. This article is licensed under a Creative Commons Attribution 4.0 International License.