KeywordsGood Corporate Governance Wealth Added Index
JEL Classification G30
Full Article
1. Introduction
The results of this study on the Good Corporate Governance’s (GCG) effect on the financial performance and the company value, including the study on the State-Owned Enterprises listed on the Indonesia Stock Exchange (IDX) for the period 2012-2015 (JSX) showed that there was a significant influence. The variables used in this study were the Independent Commissioner Board, Audit Committee and Return On Assets (ROA). These variables showed that GCG supported the achievement of the company goals (Sarafina and Saifi, 2017).
Wealth Added Index (WAI) was a performance measurement tool that has been applied empirically on the Bist 30 Index and the results show that there were 24 companies capable of creating value (Unlu et al., 2015). In its development, there were many ways which were used to assess or measure the company’s performance; including the company’s maximum value. The measuring devices of the company’s maximum value were the share price escalation, the company profits that will be received by the company in the future (Van Horne, 2009), Economic Value Added (EVA), Wealth Added Index (WAI) according to Anismar and Pradika on Djatmiko (Djatmiko, Swa, 2017).
Maximizing the company value also means maximizing the shareholders prosperity. If the shares value owned by the community increases, the people's wealth will also increase; it menas that prospering shareholders is the same as prospering the community (Brigham and Houston, 2014). The share value escalation is an indication of the company value escalation. The corporate value escalation is the impact of strong company fundamentals, professional business management by implementing good governance or corporate GCG.
The WAI advantage compared to the other performance measurement is its performance assessment which calculates the wealth excess which is generated on the Cost of Equity (CoE). The company will generate positive WAI if the Total Shareholder Return (TSR) is higher than CoE. It is considered to generate wealth added, therefore it can become a wealth creator, and vice versa (Djawahir, Swa, 2017). The measuring tool is developed by Stern Stewart & Co which stated that if the WAI is positive; it means that the company is able to create wealth for
GCG is a system and a set of rules for the relationship between the company and the shareholders, the creditors, the government and the employees; as well as internal shareholders (Effendi, 2016). GCG is a value creation perspective with the consideration that the companies build corporate governance systems and mechanisms that are able to direct company resources in creating added value for the company (Djatmiko, SWA, 2016). One of the measurements or indicators for the realization of added value is the calculation result of the company's wealth escalation as measured by WAI Wealth. GCG principles consist of transparency, accountability, responsibility, independence and fairness (Effendi, 2016). To carry out these principles; a number of things are needed since they can be used as indicators that the GCG principles are implemented properly. There are several elements that are needed to oversee the GCG implementation. They are: the Reacted Board, the Board of Commissioners, the Internal Audit and the Managerial Ownership (Indonesia Stock Exchange, 2021).
2. Theoretical Framework and Literature Review
The theory used in this research is the agency theory. Agency theory is a theory that explains the working relationship between the company owners or the investors (shareholders) and the management. The working relationship between shareholders and management creates a conflict of interest. Shareholders as owners give responsibility to management to manage the company in order to maximize the shareholder wealth. In order to make the managers willing to provide maximum results for the shareholders; managers are given high compensation. It is because the owners or the shareholders also know that the managers also have an interest in increasing his/her own wealth. So, the shareholder's interest is to maximize their wealth; while the manager's interest is to maximize his/her own wealth (Brigham and Houston, 2018).
The agency theory is applied to public companies; companies owned by the community, whose shares are purchased by the public. In theory, the management’s main objective is to maximize the shareholders wealth (shareholders wealth maximization). Maximizing shareholders’ interests does not mean ignoring the interests of the wider community; such as: customers, employees, the surrounding community and the environment (Brigham and Houston, 2018). This shows that maximizing shareholder wealth is also carried out by providing satisfaction to customers, employees, paying attention to the surrounding environment, local communities, so that the product quality, employee welfare, as well as environmental conditions around the company are well-maintained. In agency theory, there is a separation between shareholders as owners or principals and management as agents. In order to make the management carries out its responsibilities properly; a commissioner is appointed to supervise the management. A management needs to be supervised related to the purpose deviation possibility in maximizing the shareholder wealth. Besides management supervision which is done by the commissioners; an internal auditor is needed in making a reliable and accountable company performance reports. In addition, the digital system development is also needed as an effort in building management's trust in shareholders or investors.
2.1. Good Corporate Governance
Governance or GCG is the company's flagship system to produce satisfactory performance and is expected to maximize company value. In general, companies tend to implement integrated governance or GCG which includes all corporate entities (Djatmiko, Swa, 2017). Company leadership is one of the GCG keys since the leader will determine the organization direction, become a Role Model, and is responsible for making continuous improvements according to the company's vision and mission (Djatmiko, Swa, 2017).
The GCG implementation encourages companies to create and introduce new values to operational product aspects, so that services have effects in improving the company performance. The GCG implementation will bring benefits to the stakeholders which includes the shareholders, the managers, the employees, the customers, and the environment around the company (Sugiarsono, Swa, 2016). GCG as a creating perspective has added a plus point value in the GCG implementation in public companies. In the end, GCG implementation is about performance. To assess performance, various measurements can be used; such as: stock prices escalation, profit escalation, added value escalation, and WAI. The companies do not only have compliance and conformance; but, must also be able to produce the best performance.
General description of GCG implementation can be described through the GCG in Action framework as follows in Figure 1 (Sudarmadi, Swa, 2017).
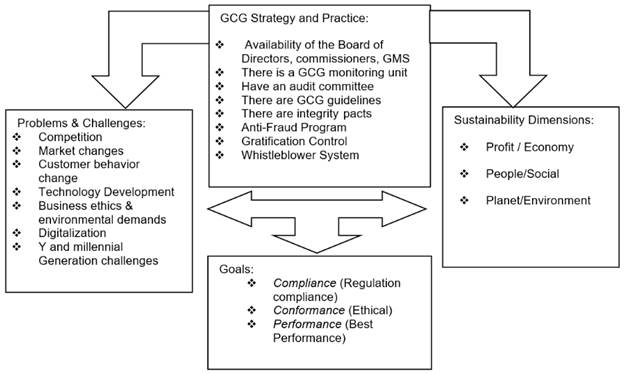
Figure 1. GCG Action Framework
The description in the GCG action framework can be explained that those who play key roles in the GCG implementation are the Board of Directors, Commissioners, GMS, committees, GCG guidelines, anti-fraud programs, gratification control and whistleblower system. GCG is carried out because of challenges which consist of competition, market changes, consumer behavior changes, technology developments, business ethics and environmental demands, digitalization, Y and millennials Generation challenges. Besides, there is also an expectation of sustainability dimensions which consist of profit or economic conditions, people / social; which is the community where the company is located and also the planet / environment where the company is located. GCG can be implemented if there are corporate entity goals in the form of compliance conformance; namely companies that have ethics and performance; namely the company performance achievement (Sudarmadi, Swa, 2017).
Based on the GCGaction framework above (Figure 1), it can be seen that one of the GCG points is Performance (best performance), besides Compliance (regulations compliance) and Conformance (ethical). So it can be concluded from the GCG action framework that all of the GCG processes have a goal or a big goal in producing performance; and in this research, one of the performance indicators is WAI. To be able to implement GCG, every company must be able to become a company that continues to improve itself, willing to learn which later will help the GCG implementation process runs better. As the result, the company will be able to carry out the GCG principles well. The GCG principles; such as: transparency, accountability, responsibility, independence and fairness, can be implemented because the Board of Directors implement them, the internal system by the audit committee, supervision from the Commissioners Board, and managerial ownership as the shareholders who have interests in GCG; so that it can produce the best performance. Management is a party who is contracted by shareholders to work for the shareholders interests.
Research Limitations
a. The variables used in this study were WAI as the dependent variable, and GCG as the independent variable. GCG was measured by the number of the Board of Directors, the number of the Board of Commissioners, the number of the Internal Audit and the managerial ownership.
b. The samples used in this study were manufacturing companies published by the IDX, and the WAI value was published through the publication of research results in SWA within the period from 2017 to 2019.
c. The companies which had an annual report ended on December 31 and had published their financial reports from 2017 up to 2019.
2.2. Hypothesis Development
The Effect of the Board of Directorson WAI
In the GCG action framework, it is indicated that the Board of Directors is one of the elements that plays a role in the GCG strategy and practice. The Board of Directors’ duties and responsibilities are to manage the company, compile an annual working plan, prepare an annual performance report to the GMS. The Board of Directors applies the GCG principles in managing the company organization. In carrying out the principles of GCG and there should be independency in making the decision. From the GCG action framework, it can be seen that the GCG implementation points are performance (best performance). The performance measurement used is WAI. In this research; what is meant by the Board of Directors is a number of the Board of Directors. The more directors boards, the better the GCG implementation because the more directors board, it is not much easier to make deviation agreements to serve the directors interests. Therefore, it can be concluded that one of the measurements of GCG implementation is the number of directors. The more directors; the better the company's performance since it will produce a positive WAI.
H1: The number of the Board of Directors has a positive effect on WAI
The Effect of The Commissioners Board
The commissioners board is a corporate division that has the responsibility and duty to supervise the company management and provide advice to the Board of Directors, supervise and be responsible for the company's management policies, review and approve the budget working plan, hold regular meetings, approve certain actions that are done by directors. This is also shown in the GCG Action Framework. The commissioners board also plays a strong role in the GCG implementation. Based on this description, the hypothesis is determined that the more the number of commissioners, the higher the WAI. It is because the more people supervise the company, the better the performance is.
H2: The number of the Commissioners Board has a positive effect on WAI
The Effect of the Audit Committee
The GCG action framework shows that the audit committee also plays a role in the GCG implementation strategy. The duties of the audit committee are to review financial information on financial performance, supervise external auditors, evaluate the effectiveness of internal control and the implementation of the internal audit function, review risk management, compliance with laws and regulations. Based on this description, the more the number of audit committees; the more it will have a positive effect on WAI.
H3: The number of Audit Committees has a positive effect on WAI
The Effect of the Managerial Ownership
The Managerial Ownership is the number of shares proportion owned by management or commissioners. In agency theory, the conflict that occurs is the interests’ difference between shareholders and management. If management becomes the shareholder, management will have shareholder interests; maximizing company value and performance. Therefore, it can be concluded that the greater the managerial shareholder ownership proportion, the bigger positive effect it will have on WAI.
H4: The Number of Managerial Ownership has a positive effect on WAI
3. Research Method
3.1. Research Data Collection Method
In this study, the researchers examined the GCG effect on WAI, using a quantitative approach with multiple regression analysis. GCG was measured by four variables. They were: the number of directors, number of commissioners, number of audit committees and managerial ownership. Based on the regression analysis objectives, the data collection was carried out. In the early stages, the research data collection methods were based on the data needs. GCG data needs were related to the data on the number of commissioners, number of directors, number of audits and management share ownership. This data collection method used the secondary data collection methods in a form of published archival data, from the following sources:
- Indonesia Stock Exchange (IDX) - www.idx.co.id (Indonesia Stock Exchange, 2021).
- annual reports for the period 2017 - 2019.
- WAI data was obtained from the Wealth Creator survey results from Swa magazine for four (4) years starting in 2017, 2018, 2019 and 2020.
The population and the sample of this study were the manufacturing companies listed or published by the Indonesia Stock Exchange (IDX). This study determined sampling with a purposive sampling method; sampling with special objectives or special characteristics described as follows:
a. Manufacturing companies registered and published by the IDX for the period between 2017 – 2019
b. The company has an annual report
c. The annual report lists the Board of Directors, the commissioners board and there is data on internal audit and managerial ownership
d. Have WAI data contained in the SWA data published through SWA magazine.
The variables used in this study are described as follows: the dependent variable, namely WAI, is a factor that is influenced by the independent variable which consists of the number of commissioners, directors board, number of audit committees, and managerial share ownership. The data analysis tools used were descriptive statistics, panel data regression.
3.2. Data Types
The types of data used in this study are time series and cross section which are panel data. This study used the data taken from the Indonesia Stock Exchange (IDX). The data used was a secondary data; in the form of manufacturing companies annual reports for the period between 2017 - 2019. The data sources used in this study were obtained from the Indonesia Stock Exchange (IDX) website (www.idx.co.id - Indonesia Stock Exchange, 202), and the official website of manufacturing companies and published data from SWA magazine's survey of value creators with WAI values.
Data selection refers to companies that have consecutive WAI values each year, have annual report data that contains the value of the number of directors, the number of commissioners, the number of audit committees and the proportion of managerial share ownership.
3.3. Research Variables
Dependent Variables
The dependent variable is the variable that is influenced by the independent variable. In this study, the dependent variable is WAI, developed by Stern Value Management. WAI is an excess wealth indicator that is generated from the minimum return that is expected by the shareholders or the investors. The expected return is based on the potential cost and risk borne by investors, which is the Cost of Equity(CoE).
WAI is Total Share Return > CoE.
In this study, the WAI calculation was not carried out, but took the advantage of the WAI calculation results that had been published by SWA magazine.
Independent Variables
1. The Board of Directors. The roles of Directors Board are managing the company, compiling an annual work plan, making a performance annual report to the GMS. The Board of Directors applies the GCG principles in managing the company organization. The size of the Board of Directors in this study is the number of the Board of Directors.
2. The Commissioners Board. The commissioners board is a corporate organ that has the responsibility and duty to supervise the company management and provide advice to the board of directors, supervise and be responsible for the company's management policies, review and agree on the budget working plan, hold regular meetings, approve certain actions taken by the Board of Directors. The size of the Commissioners Board in this study is the number of the Commissioners Board of the company.
3. Audit Committee. The audit committee is a group of people that are appointed to review financial information on financial performance, supervise the external auditors, evaluate the internal control effectiveness and the implementation of internal audit functions, review risk management, comply with laws and regulations. The size of the Audit Committee in this study is the number of audit committee personnel.
4. Managerial Share Ownership. Managerial ownership is the number of shares proportion owned by management or commissioners. In agency theory, the conflict that occurs is the interests difference between shareholders and management. Managerial ownership is calculated from the shares owned by management divided by the total outstanding shares multiplied by 100%.
![]()
3.4. Panel Data Analysis (Regression)
Panel data regression analysis was used to determine the independent variables effect on the dependent variable. The regression equation used in the study is stated as follows:
![]()
WAI = Wealth Added Index
Dir = Number of Directors on Board of Directors
ComB= number of members on the Commissioners Board
ACom = number of members of the Audit Committee
MSO = managerial share ownership
![]() is = standard error
is = standard error
![]() = constant
= constant
![]() = regression coefficient of each variable
= regression coefficient of each variable
Classic assumption test
To fulfill the regression test requirements, a classic assumption test is needed and it consists of a normality test, multicollinearity test, heteroscedasticity test, and autocorrelation test; as well as a parameter significance test. The first test to be performed is the normality test. The normality test uses the Jarque Bera (JB) test. This normality test is a test to assess the data normality. If the JB result is greater than alpha 0.05, it means that the data is normally distributed. However, if the significance is less than 0.05, the data is not normally distributed. A multicollinearity test is a test is used to assess whether there is a relationship between the independent (free) variables in the regression. The required condition is that there is no multicollinearity between independent variables. The next test is the heteroscedasticity test, which is a test to determine whether the regression contains heteroscedasticity or not. To find out heteroscedasticity, it is done by looking at the result. If it is significant> 0.05, the regression model does not contain heteroscedasticity. The last classical assumption test is the significance test; the t test to show the variable effect which provides the variation explanation of the dependent variable. The t test is used to test whether the hypothesis is accepted or rejected as follows:
Ho: The independent variable has no effect on the dependent variable
Ha: The independent variable has an effect on the dependent variable
The significance which is determined in this study is 5% (0.05). If the significant> 0.05 Ho is accepted, it means that there is no effect between the independent variable and the dependent variable partially. If the significant <0.05 then Ho is rejected, meaning that there is an effect between the independent variable and the dependent variable partially.
4. Data Analysis
4.1. Statistical Description
The research entitled the analysis of the effect of the number of directors, the number of commissioners, the number of audit commissions, and the ratio of share ownership of directors with WAI used a 17-company sample with time series between 2017-2019. The criteria for the 17 companies used as samples were companies that fall into the LQ-45 category. Of the 45-company data, 17 companies were selected with 4 data variables; as the result, there were 51 complete data for data analysis.
Table 1. Descriptive statistics
| WAI | Number of Directors | Number of Commissioners | Number of Audit Committee | Share Ownership Ratio; Directors | |
| Mean | 4871469. | 8.588235 | 6.901961 | 3.529412 | 65.94118 |
| Median | -10031288 | 8.000000 | 7.000000 | 3.000000 | 86.00000 |
| Maximum | 2.92E+08 | 12.00000 | 13.00000 | 6.000000 | 100.0000 |
| Minimum | -1.49E+08 | 6.000000 | 3.000000 | 1.000000 | 0.000000 |
| Std. Dev. | 82463239 | 2.108805 | 2.410435 | 1.189167 | 39.00278 |
| Skewness | 1.315959 | 0.205118 | 0.548769 | 0.398005 | -0.610346 |
| Kurtosis | 5.530214 | 1.638272 | 3.229020 | 3.182039 | 1.743263 |
| Jarque-Bera | 28.32408 | 4.298019 | 2.671209 | 1.416883 | 6.522635 |
| Probability | 0.000001 | 0.116600 | 0.262999 | 0.492411 | 0.038338 |
| Sum | 2.48E+08 | 438.0000 | 352.0000 | 180.0000 | 3363.000 |
| Sum Sq. Dev. | 3.40E+17 | 222.3529 | 290.5098 | 70.70588 | 76060.82 |
| Observations | 51 | 51 | 51 | 51 | 51 |
| Cross-sections | 17 | 17 | 17 | 17 | 17 |
Source: author calculations, using data from JSX Monthly (2020)
From the data above, it can be seen:
· The average WAI value from all companies sample was 4.8 million with 8.5 directors. The average number of commissioners was 6.9, the number of audit commissions was 3.5 and the ratio of directors' share ownership was 65 percent.
· When viewed, the minimum and maximum values had a very varied range between variables. The minimum WAI variable value was -149 billion and the highest was 292 billion. The smallest variable number of directors was 6 and the highest number was 12. Meanwhile, the number of commissioners had a range of 3 to 13. The number of audit commissions had a slightly shorter range, namely 1 to 6. Meanwhile, the share ownership ratio was from 0 to 100 percent.
· When viewed from the data normality distribution, it was clear from the table above that the WAI variable and the share ownership ratio by the directors were not normally distributed because the probability value was less than 5 percent. Meanwhile, the variable data; The number of Directors, the number of Commissioners, and the number of audit commissions were normally distributed because the probability value was greater than 5 percent, namely 11 percent, 26 percent, and 49 percent respectively.
4.2. Hypothesis Testing
According to Nachrowi (2006), hypothesis testing is useful for testing the regression coefficients significance obtained. It means, the regression coefficient obtained is statistically not equal to zero, because if it is equal to zero it can be said that there is not enough evidence to state that the independent variable has an influence on the dependent variable. For this purpose, all regression coefficients must be tested. There are two types of hypothesis testing on the regression coefficient that can be done, namely t-test and F-test.
t-test
If the F-test is used to test the regression coefficients at the same time, the t-test is used to test the regression coefficients individually. The test is carried out on the population regression coefficient, whether it is equal to zero, which means that the independent variable does not have a significant effect on the dependent variable, or is not equal to zero, which means that the independent variable has a significant effect on the dependent variable. The results of the t test can be seen in the table below.
Table 2. Variable results
| Variable Name | Coefficient | t-Value | Prob | Notes |
| Constant | -2.27E+08 | -2.915643 | 0.0067 | - |
| Number of Directors | 27279908 | 2.991442 | 0.0055 | Significant |
| Number of Commissioners | -7519308. | -1.078887 | 0.2892 | Not Significant |
| Number of Audit Committee | 29524652 | 2.707009 | 0.0111 | Significant |
| Stock Ratio | -828059.0 | -2.395329 | 0.0231 | Significant |
| F Test Value | 4.38 | - | 0.000 | Significant |
| R Square | 0.74 | - | - | - |
From the tests results that have been presented in Table 2, the following conclusions can be drawn:
· The number of Directors in a Board had a significant effect on WAI. This was indicated by the probability value of less than 5 percent, namely 0.000.
· The number of Commissioners had no significant effect on WAI. This was indicated by the probability value of 28 percent. This was higher than the cut-of-point figure which was used which was 5 percent.
· The number of Audit Commissions had a significant effect on WAI. This was indicated by the probability value of less than 5 percent, namely 1 percent.
· Total share ownership ratio had a significant effect on WAI. This was indicated by the probability value of less than 5 percent, namely 2.3 percent.
F-Test.
The F-test is intended to test the regression coefficient (slope) hypothesis simultaneously, in other words it is used to ensure that the selected model is appropriate or not, in interpreting the effect of the independent variable on the dependent variable. From the table above (Table 2), it can be concluded that the number of directors, the number of commissioners, the number of audit commissions, and the share ownership ratio at the same time had significant effects on WAI. This was indicated by the coefficient value of 4.38 with a probability of 0.000.
Determination Coefficient
The determinationcoefficient (Goodness of Fit) is denoted by the R-squares which is an important measurement in regression, because it can inform whether or not the estimated regression model is good. The value of determination coefficient reflects how much variation of the dependent variable can be explained by the independent variable. If the determinationcoefficient is equal to 0, it means that the variation of the dependent variable cannot be explained by the independent variables at all. Meanwhile, if the coefficient of determination is equal to 1, it means that the variation in the dependent variable as a whole can be explained by the independent variables. Thus good or bad a regression equation is determined by its R-squares which have a value between zero and one. From the dataresults processed in the table above, the determination coefficient value was 74 percent. This means that variations in the number of directors, number of commissioners, number of audit commissions, and share ownership ratios could explain the WAI variation of 74 percent. The remaining 26 percent were explained by other variables that were not existed in the equation model.
5. Conclusions and Recommendations
5.1. Conclusions
Considering the purpose of this study, the following conclusions can be drawn:
1. Based on the above analysis, it could be concluded that GCG with the measurements of the number of directors, number of commissioners, number of audit commissions, and share ownership ratio significantly affected WAI. This was indicated by the coefficient value of 4.38 with a probability of 0.000.
2. The number of Directors had a significant effect on WAI, this was indicated by the probability value of less than 5 percent, namely 0.000
3. The number of Directors had a significant effect on WAI. This was indicated by the probability value of less than 5 percent, namely 0.000
4. The number of Commissioners did not have a significant effect on WAI, this was indicated by the probability value of 28 percent. This was higher than the number of the cut of point figure which was used, namely 5 percent.
5. The number of Audit Committees had a significant effect on WAI. This was indicated by the probability value which was less than 5 percent, namely 1 percent.
6. Total share ownership ratio had a significant effect on WAI. This was indicated by the probability value which was less than 5 percent, namely 2.3 percent.
5.2. Recommendations
The results of the study lead us to the following recommendations for managers and future studies:
1. Based on the conclusions of the results in this study, then a recommendationthat the company should implement Good Corporate Governance (GCG) in which the implementation is guarded by the Board of Directors, CommissionersBoard, audit committee, share ownership. Hopefully, it can have a positive effect on the performance shown by the Wealth Added Index (WAI).
2. The theoretical contribution in this study is the influence of GCG on WAI, which still has to be proven by further research.
3. The research development in the future is the effect of GCG on WAI with performance as an intervening variable
References
- Artikis, P.G., 2008. Wealth Added Financial Management Research [online] Available at: http://mibes.teilar.gr/ebook/ebooks/artikis%202-17.pdf [Accessed on 11 February 2021].
- Brigham, E.F. and Houston, J.F., 2018. Dasar-Dasar Manajemen Keuangan, Ed.14. Jakarta: Salemba Empat.
- Djatmiko, H., 2016. GCG Sebagai Pemicu Nilai Tambah. SWA, 27 XXXI (21 Desember 2015 - 6 Januari 2016), pp.26 - 27.
- Djawahir, K., 2017. SWA 100 2017 Ajang Pembuktian Bagi The True Wealth Creators. SWA, 13 XXXIII (19 Juni - 5 Juli 2017), pp.24 - 37.
- Djawahir, K., 2018. SWA 100 2018: Yang Melejit Di Tengah Stagnasi. SWA, 15 XXXIV (26 Juli - 5 Agustus 2018), pp.20 -36.
- Djawahir, K., 2019. SWA 100 2019: Dominasi Bank Di Peringkat Teratas. SWA, (SWA 13 XXXV 11 - 24 Juli 2019), pp.26 - 38.
- Djawahir, K., 2020. SWA 100 2020: Barisan Wealth Creators Makin Menciut. SWA, (SWA 15 XXXVI 30 Juli - 12 Agustus 2029), pp.24 -31.
- Effendi, M.A., 2016. The Power of Good Corporate Governance. Teori dan Implementasi, edisi 2. Jakarta: Salemba Empat.
- Gulo, W.A. and Ermawati, W.J., 2011. Analisis Economic Value Added (EVA) dan Market Value Added (MVA) sebagi alat ukur kinerja Keuangan PT SA. Jurnal Manajemen dan Organisasi, II(2), p.123-133.
- Hien, K.S. and Mariani, F.I., 2014. Financial Management canvas. Jakarta: Elex Media Komputindo.
- Indonesia Stock Exchange, 2021. Stock information on companies listed on Indonesia Stock Exchange [online] Available at: http://www.idx.co.id/ [Accessed on 11 February 2021].
- Mispiyanti and Kristanti, I.N., 2016. Comparative Analysis of Commercial Banks In Indonesia Asean Best Results By Wealth Creator 2016. Proceedings-International Conference of Banking, Accounting, Management and Economics, October 26-27, Magelang, Indonesia.
- Pambudi, T., 2019. Berselancar Di Tengah Tekanan. SWA, 13 XXXV (11 - 24 Juli 2019), pp.23 - 24.
- Prasinta, D., 2012. Pengaruh Good Corporate Governance terhadap Kinerja Keuangan. Accounting Analysis Journal, 1(2). doi: 10.15294/aaj.v1i2.655
- Sarafina, S. and Saifi, M., 2017. Pengaruh Good Corporate Governance terhadap Kinerja Keuangan & Nilai Perusahaan (studi pada Badan Usaha Milik Negara yang terdaftar di Bursa Efek Indonesia Periode 2012 – 2015. Jurnal Administrasi Bisnis, 50(3), pp.108-117.
- Sudarmadi, S., 2017. Mereka Yang Terpercaya. SWA, 27 XXXII (20 Desember 2016 - 4 Januari 2017), pp.30-36.
- Sugiarsono, J., 2016. Menyelaraskan Penerapan GCG Dengan Penciptaan Nilai. SWA, 27 XXXI (21 Desember 2015 - 6 Januari 2016), pp.28 -33.
- Unlu, U., Saygin, O., Ersoy, E., 2015. Wealth Added Index (WAI) In Performance Measurement: An Empirical Aplication on Bist 30 Index. Journal of Economics, Finance and Accounting, 2(1), pp.18-28.
- Van Horne, J.C. and Wachowicz, J.M., 2009. Prinsip – Prinsip Manajemen Keuangan. Jakarta: Salemba Empat.
Article Rights and License
© 2021 The Authors. Published by Sprint Investify. ISSN 2359-7712. This article is licensed under a Creative Commons Attribution 4.0 International License.